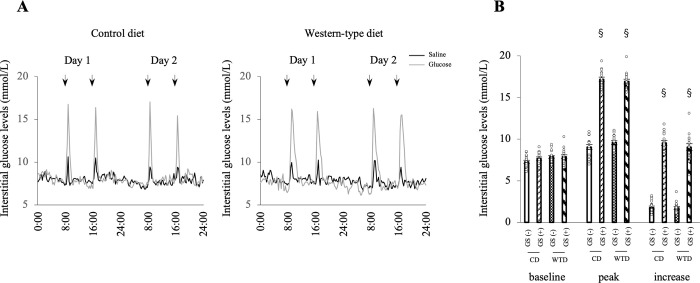
Fig 1. GSs are induced by intraperitoneal glucose administration.
A: Representative profiles of interstitial glucose levels in four groups: GS (-), black; GS (+), gray. Interstitial glucose levels were continuously recorded with a Libre® monitor for 48 hours. Arrows indicate the time of saline or glucose administration. B: Baseline, peak and increase in interstitial glucose levels. § P < 0.001 compared with the GS group, two-way ANOVA. No interaction was detected between diet and GS factors. The data are presented as the means ± SEM. N = 7 rats per group. CD, control diet; WTD, Western-type diet; GS, glucose spike. The GS (-) group consisted of rats administered saline, and the GS (+) group consisted of rats administered glucose.

