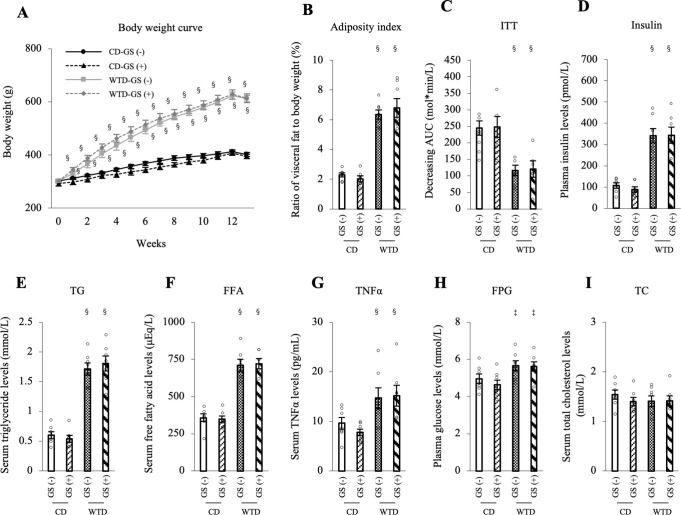
Fig 3. Endothelial dysfunction in the WTD-GS (+) group is independent of metabolic parameters.
A: Body weight curve over the duration of feeding and administration. § P < 0.001 comparison between diet groups, two-way repeated-measures ANOVA. B: Adiposity index (the ratio of epididymal, retroperitoneal and mesenteric fat mass to body weight). C: ITT. Insulin resistance is presented as the decreasing glucose AUC. D-I: Plasma insulin (D), serum TG (E), FFA (F), TNFα (G), FPG (H), and serum TC (I) levels. ‡ P < 0.005 and § P < 0.001 for the comparison between diet groups, two-way ANOVA. No interaction was detected between diet and GS factors. Data are presented as the means ± SEM. N = 7 rats per group. CD, control diet; WTD, Western-type diet; GS, glucose spike.

