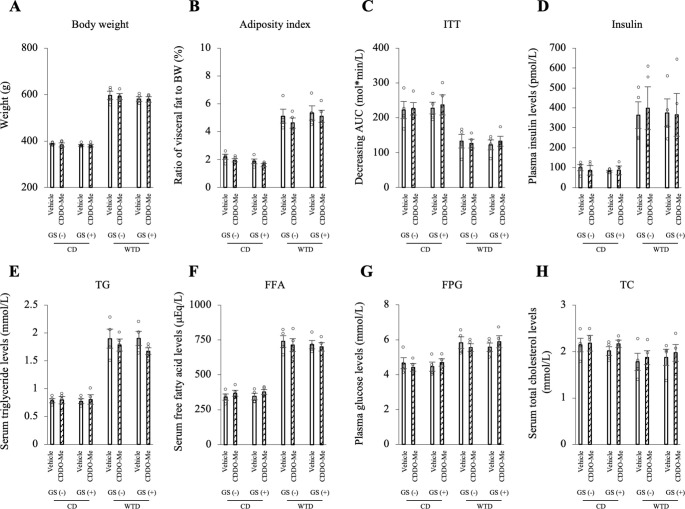
Fig 8. CDDO-Me (3 mg/kg) does not affect the body weight, fat mass or blood lipid profile of any group.
A: Body weight over the duration of feeding and administration. B: Adiposity index (the ratio of epididymal, retroperitoneal and mesenteric fat mass to body weight). C: ITT. Insulin resistance is presented as the decreasing glucose AUC. D-H: Plasma insulin (D), serum TG (E), FFA (F), FPG (G) and serum TC (H) levels. No significant differences were observed between the vehicle and CDDO-Me in each group using the Bonferroni correction. The data are presented as the means ± SEM. N = 4 rats per group. CD, control diet; WTD, Western-type diet; GS, glucose spike.

