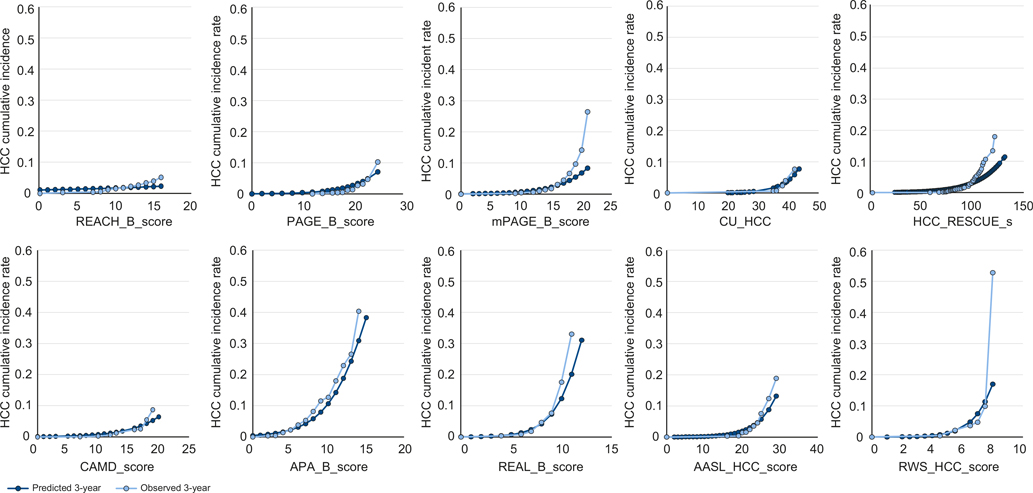
Fig. 1. Calibration plot of HBV-HCC prediction models for HCC risk at 3 years.
X axis denotes the scores of HBV-HCC prediction model and Y axis denotes HCC cumulative incidence rate, ranging from 0 to 1. Calibration plots were made to visualize the relationship between predicted risk score and observed HCC risk within the 3-year time window using a logistic regression model. AASL-HCC, age, albumin, sex, liver cirrhosis-HCC; AFP, alpha-fetoprotein; APA-B, age, platelet, AFP; CAMD, cirrhosis, age, male sex, and diabetes mellitus; CU-HCC, Chinese University HCC; HCC, hepatocellular carcinoma; HCC-RESCUE, HCC-Risk Estimating Score in CHB patients Under Entecavir; mPAGE-B, modified PAGE-B; REACH-B, Risk estimation for hepatocellular carcinoma in chronic hepatitis B; REAL-B, Real-World Effectiveness From the Asia Pacific Rim Liver Consortium for HBV Risk Score; RWS-HCC, Real-world risk score for hepatocellular carcinoma.

