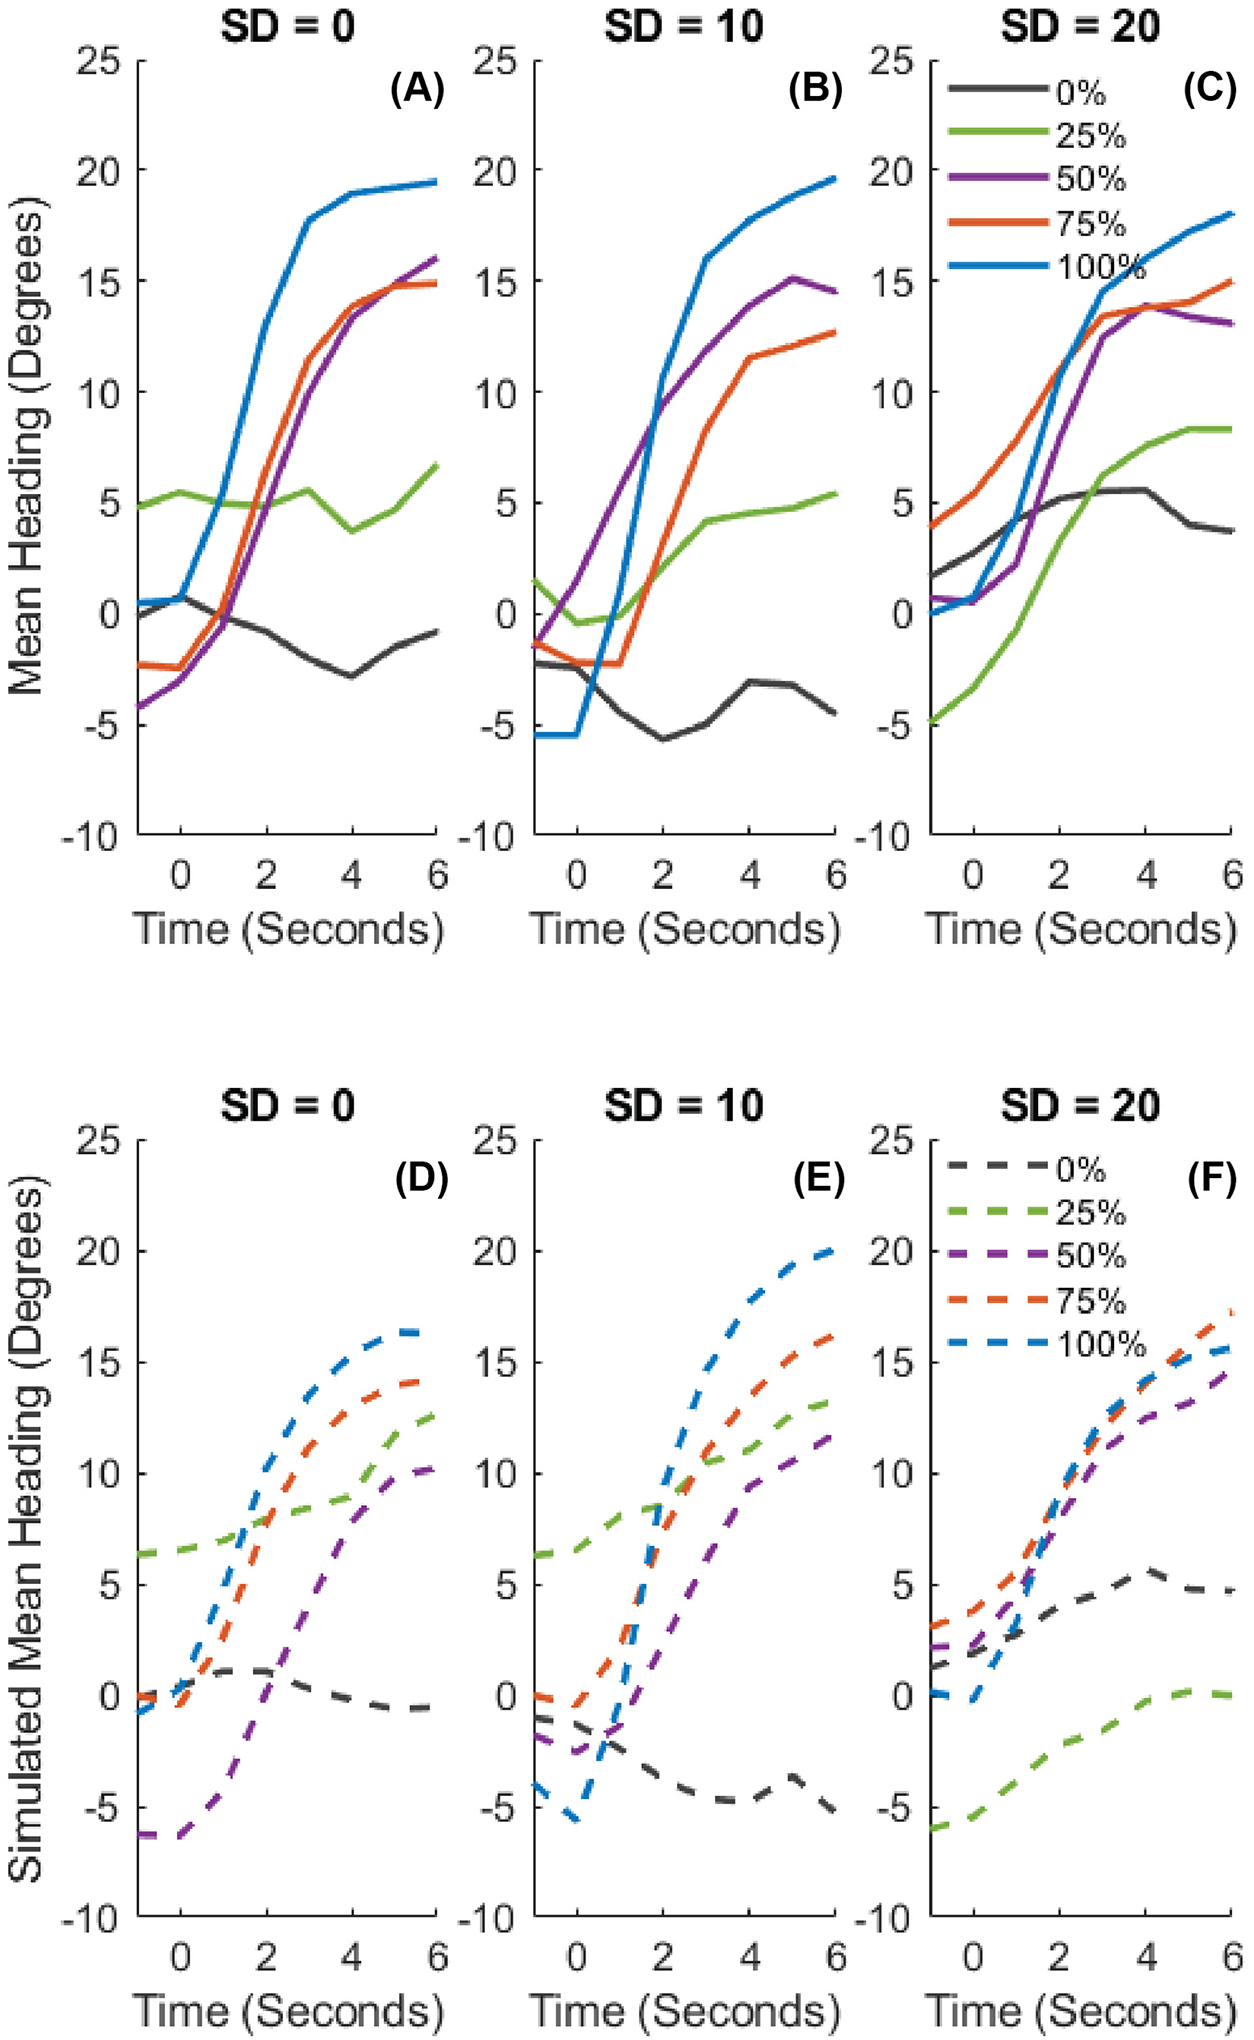
Figure 10.

Mean time series of heading for each condition in Experiment 3. (A, B, C) Human heading over time in each coherence condition (SD=0°, 10°, 20°, respectively). Curves represent the proportion of the crowd in the subgroup. (D, E, F) Model simulations of heading over time in the corresponding conditions. Slopes indicate the attractiveness of the mean heading in the neighborhood, and are highly similar for humans and model: they increase with subgroup proportion, but not with subgroup coherence.
