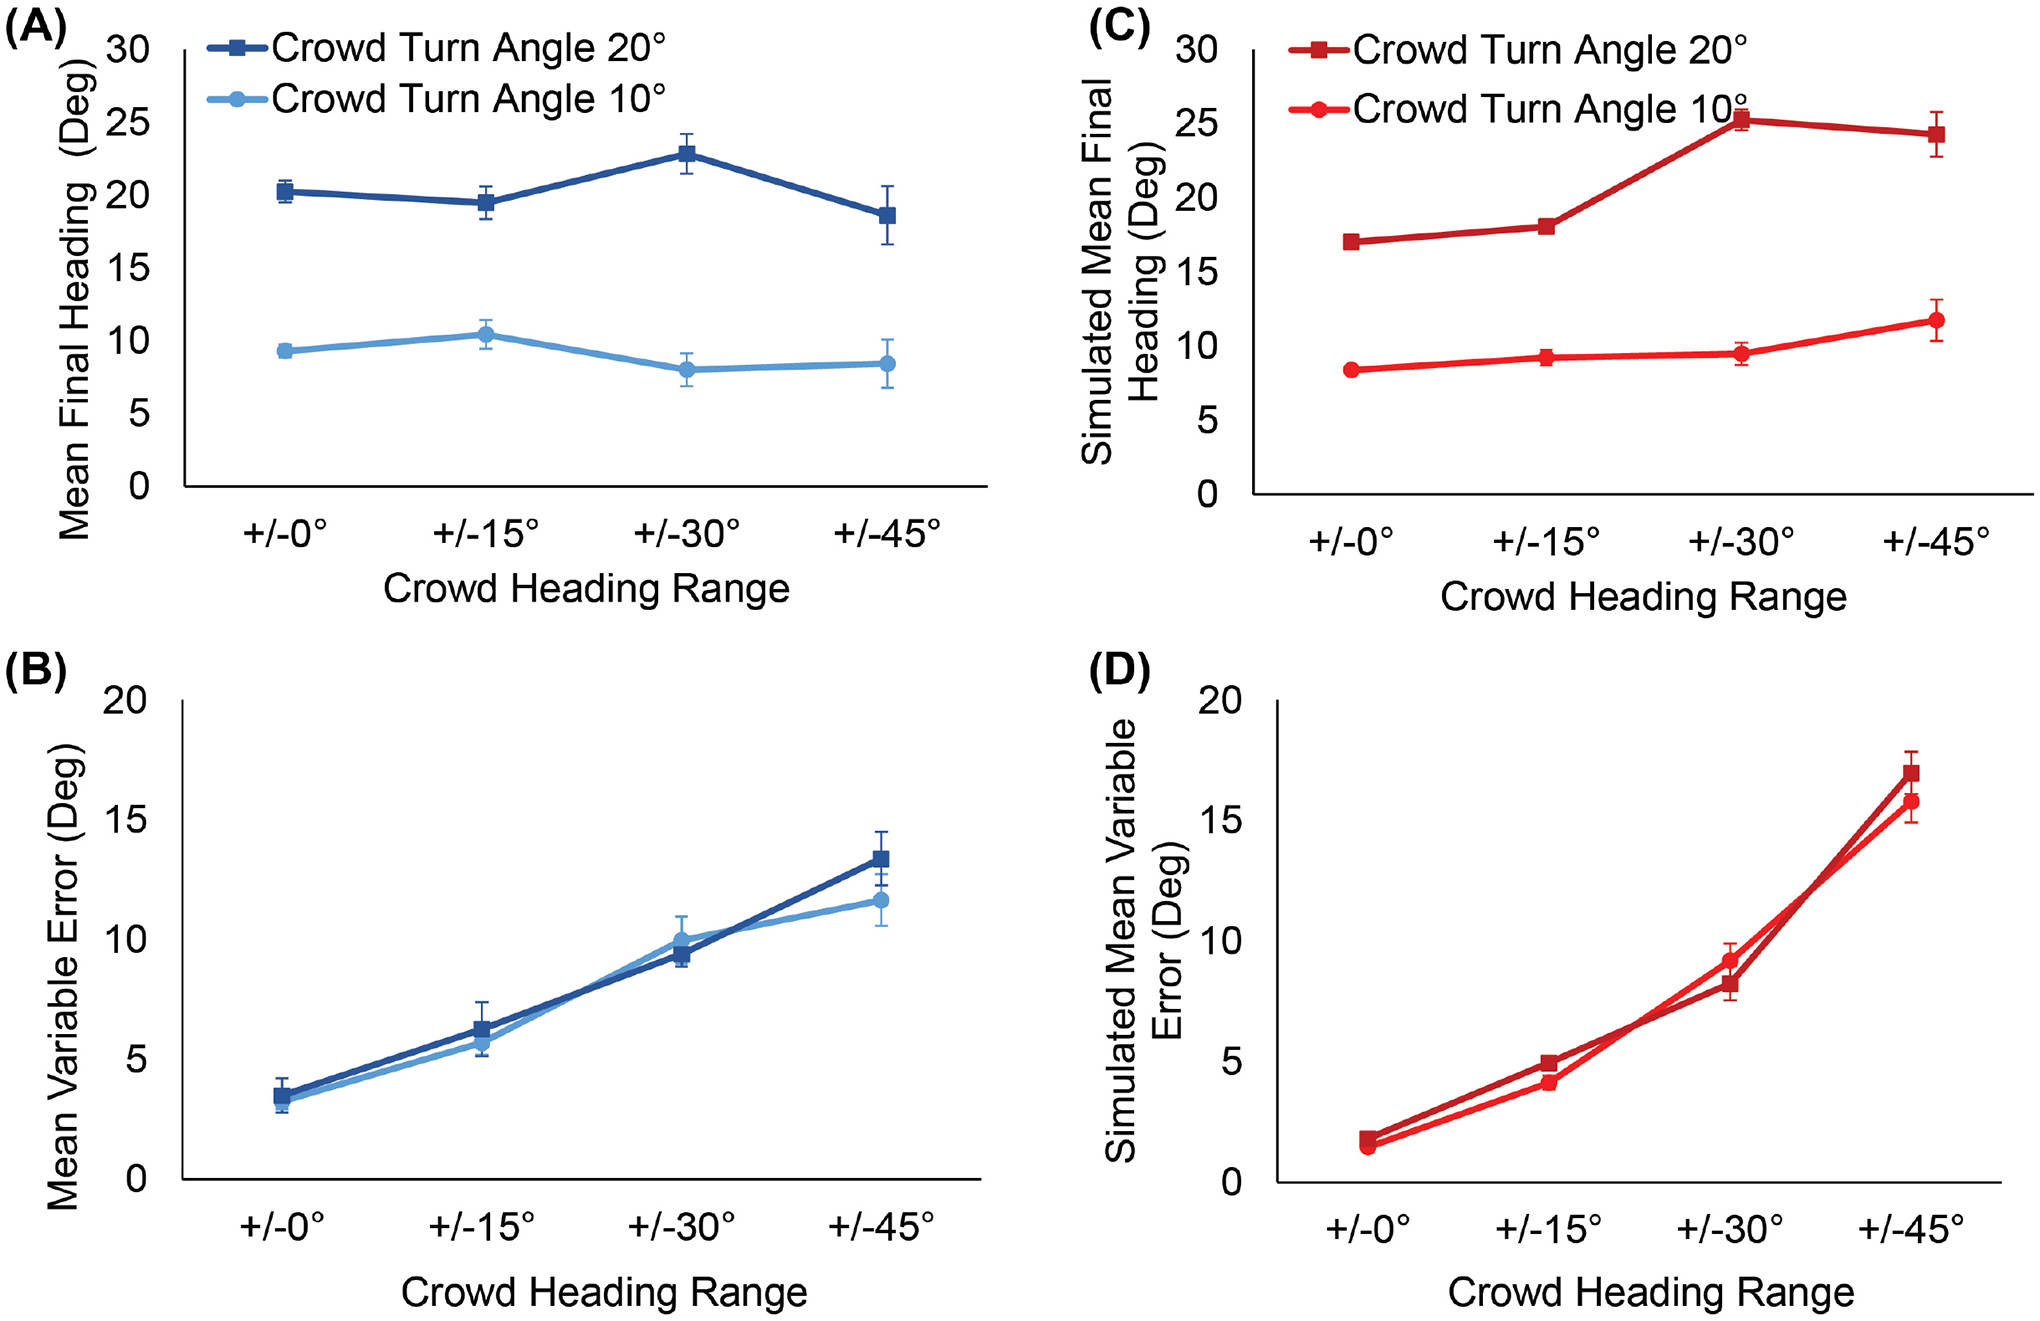
Figure 2.

Results of Experiment 1. (A) Mean final heading as a function of crowd noise (heading range in the virtual crowd), for human participants. Curves represent the crowd’s mean turn angle. (B) Mean variable error in final heading across trials as a function of crowd noise, for the participants. (C) Model simulations of mean final heading and (D) mean variable error, corresponding to the human data in panels A and B. For both human and model, final heading increases with crowd turn angle, whereas variable error increases with crowd noise. Error bars represent the standard error of the mean (±SEM).
