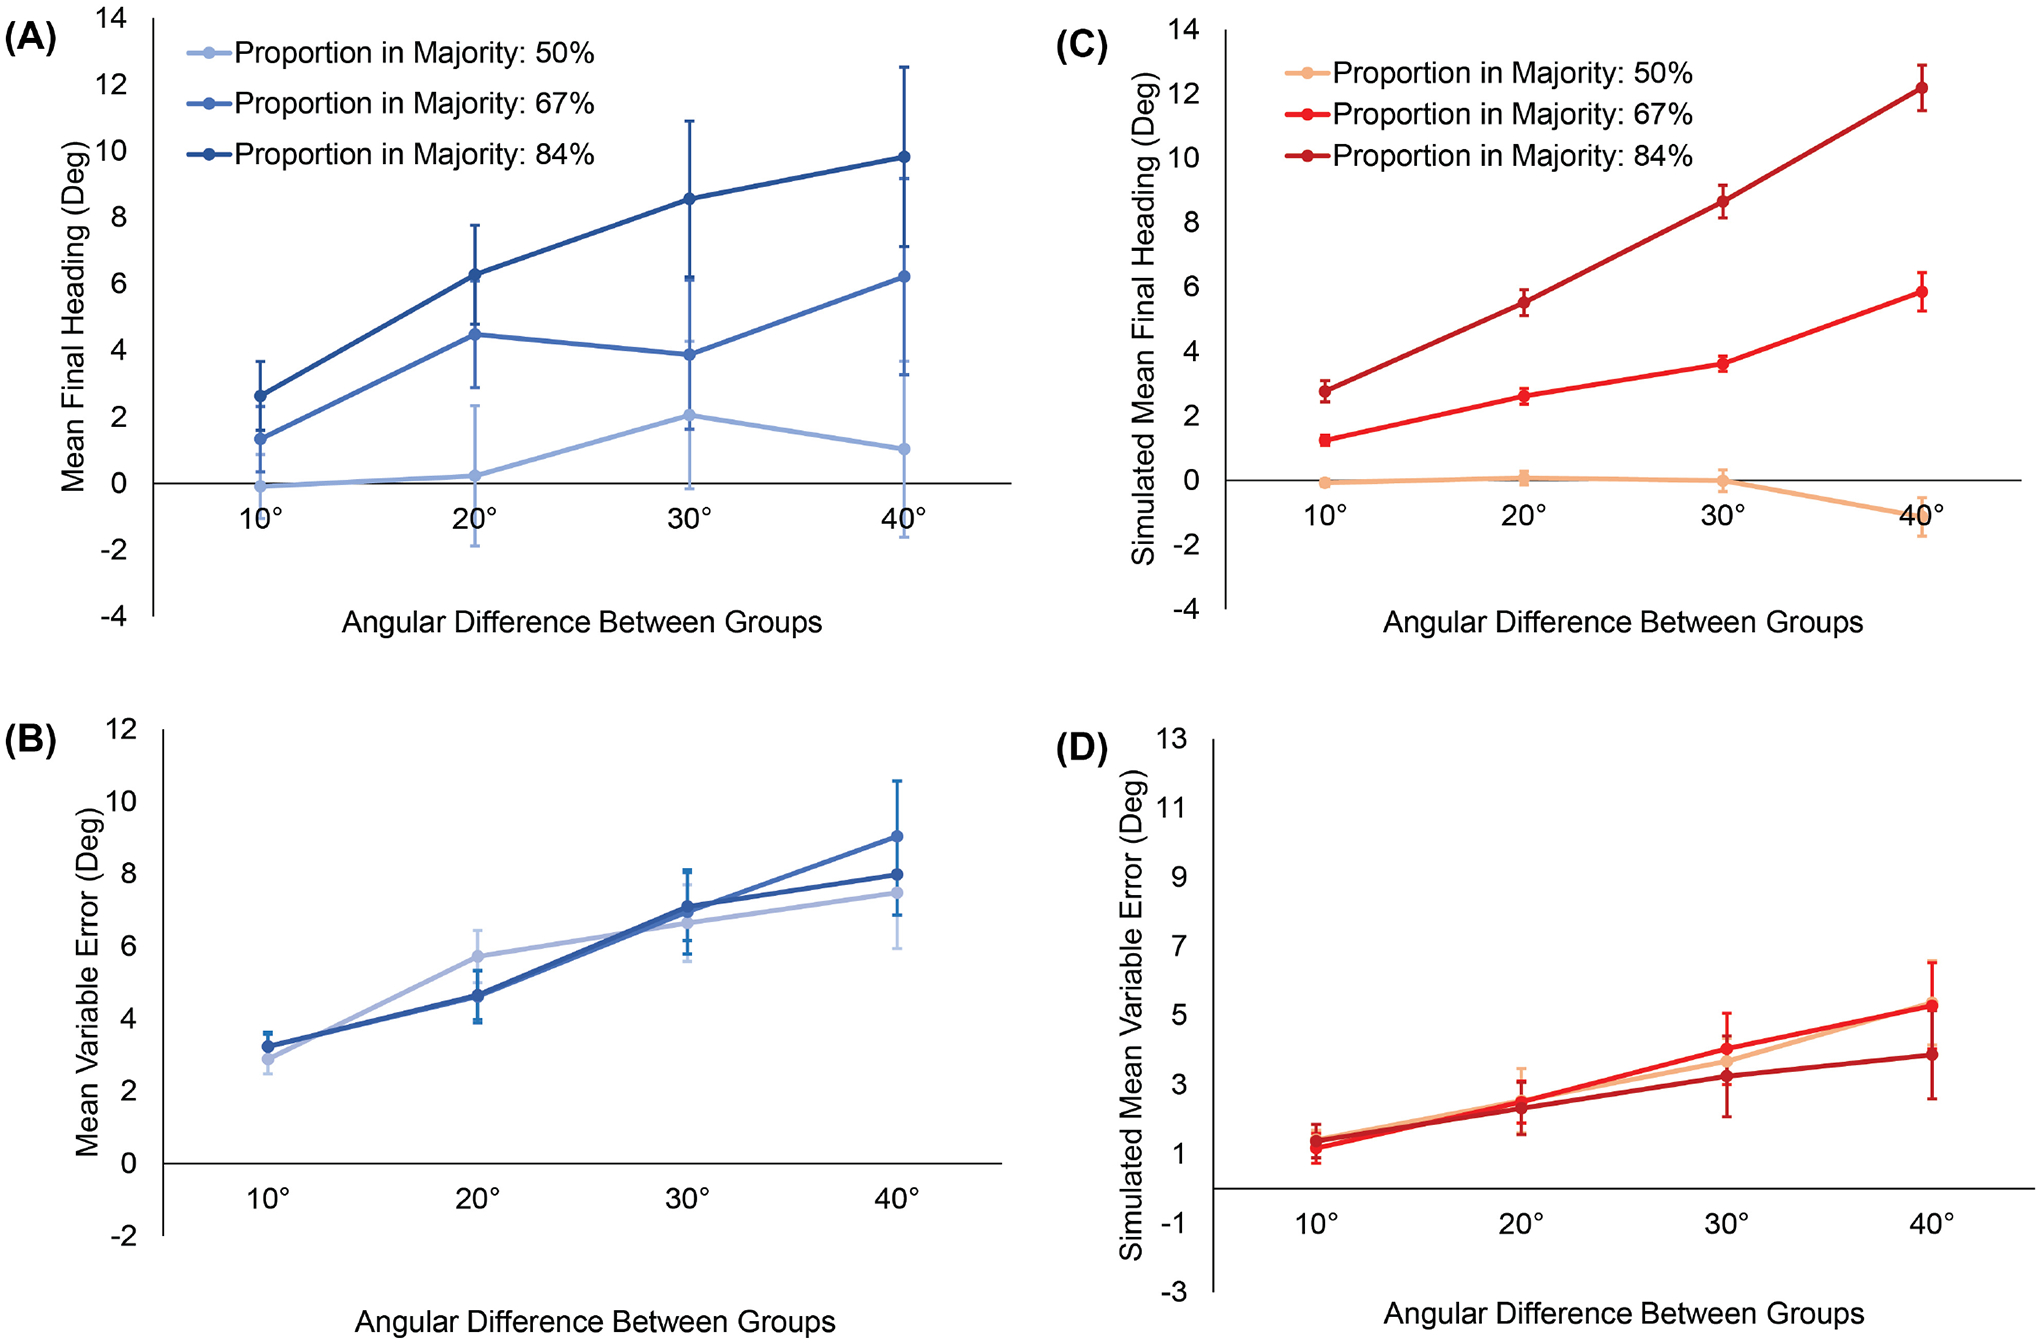
Figure 5.

Results of Experiment 2. (A) Mean final heading and (B) mean variable error as a function of the angular difference between groups, where positive heading values are in the direction of the majority group. Curves represent the proportion of the crowd in the majority. Panels A and B summarize the data in the histograms of Figure 4. (C) Model simulations of mean final heading and (D) mean variable error corresponding to the human data in panels A and B. For human and model, final heading increases with both the proportion in the majority and the angular difference, whereas the variable error only increases with angular difference. Error bars represent the standard error of the mean (±SEM).
