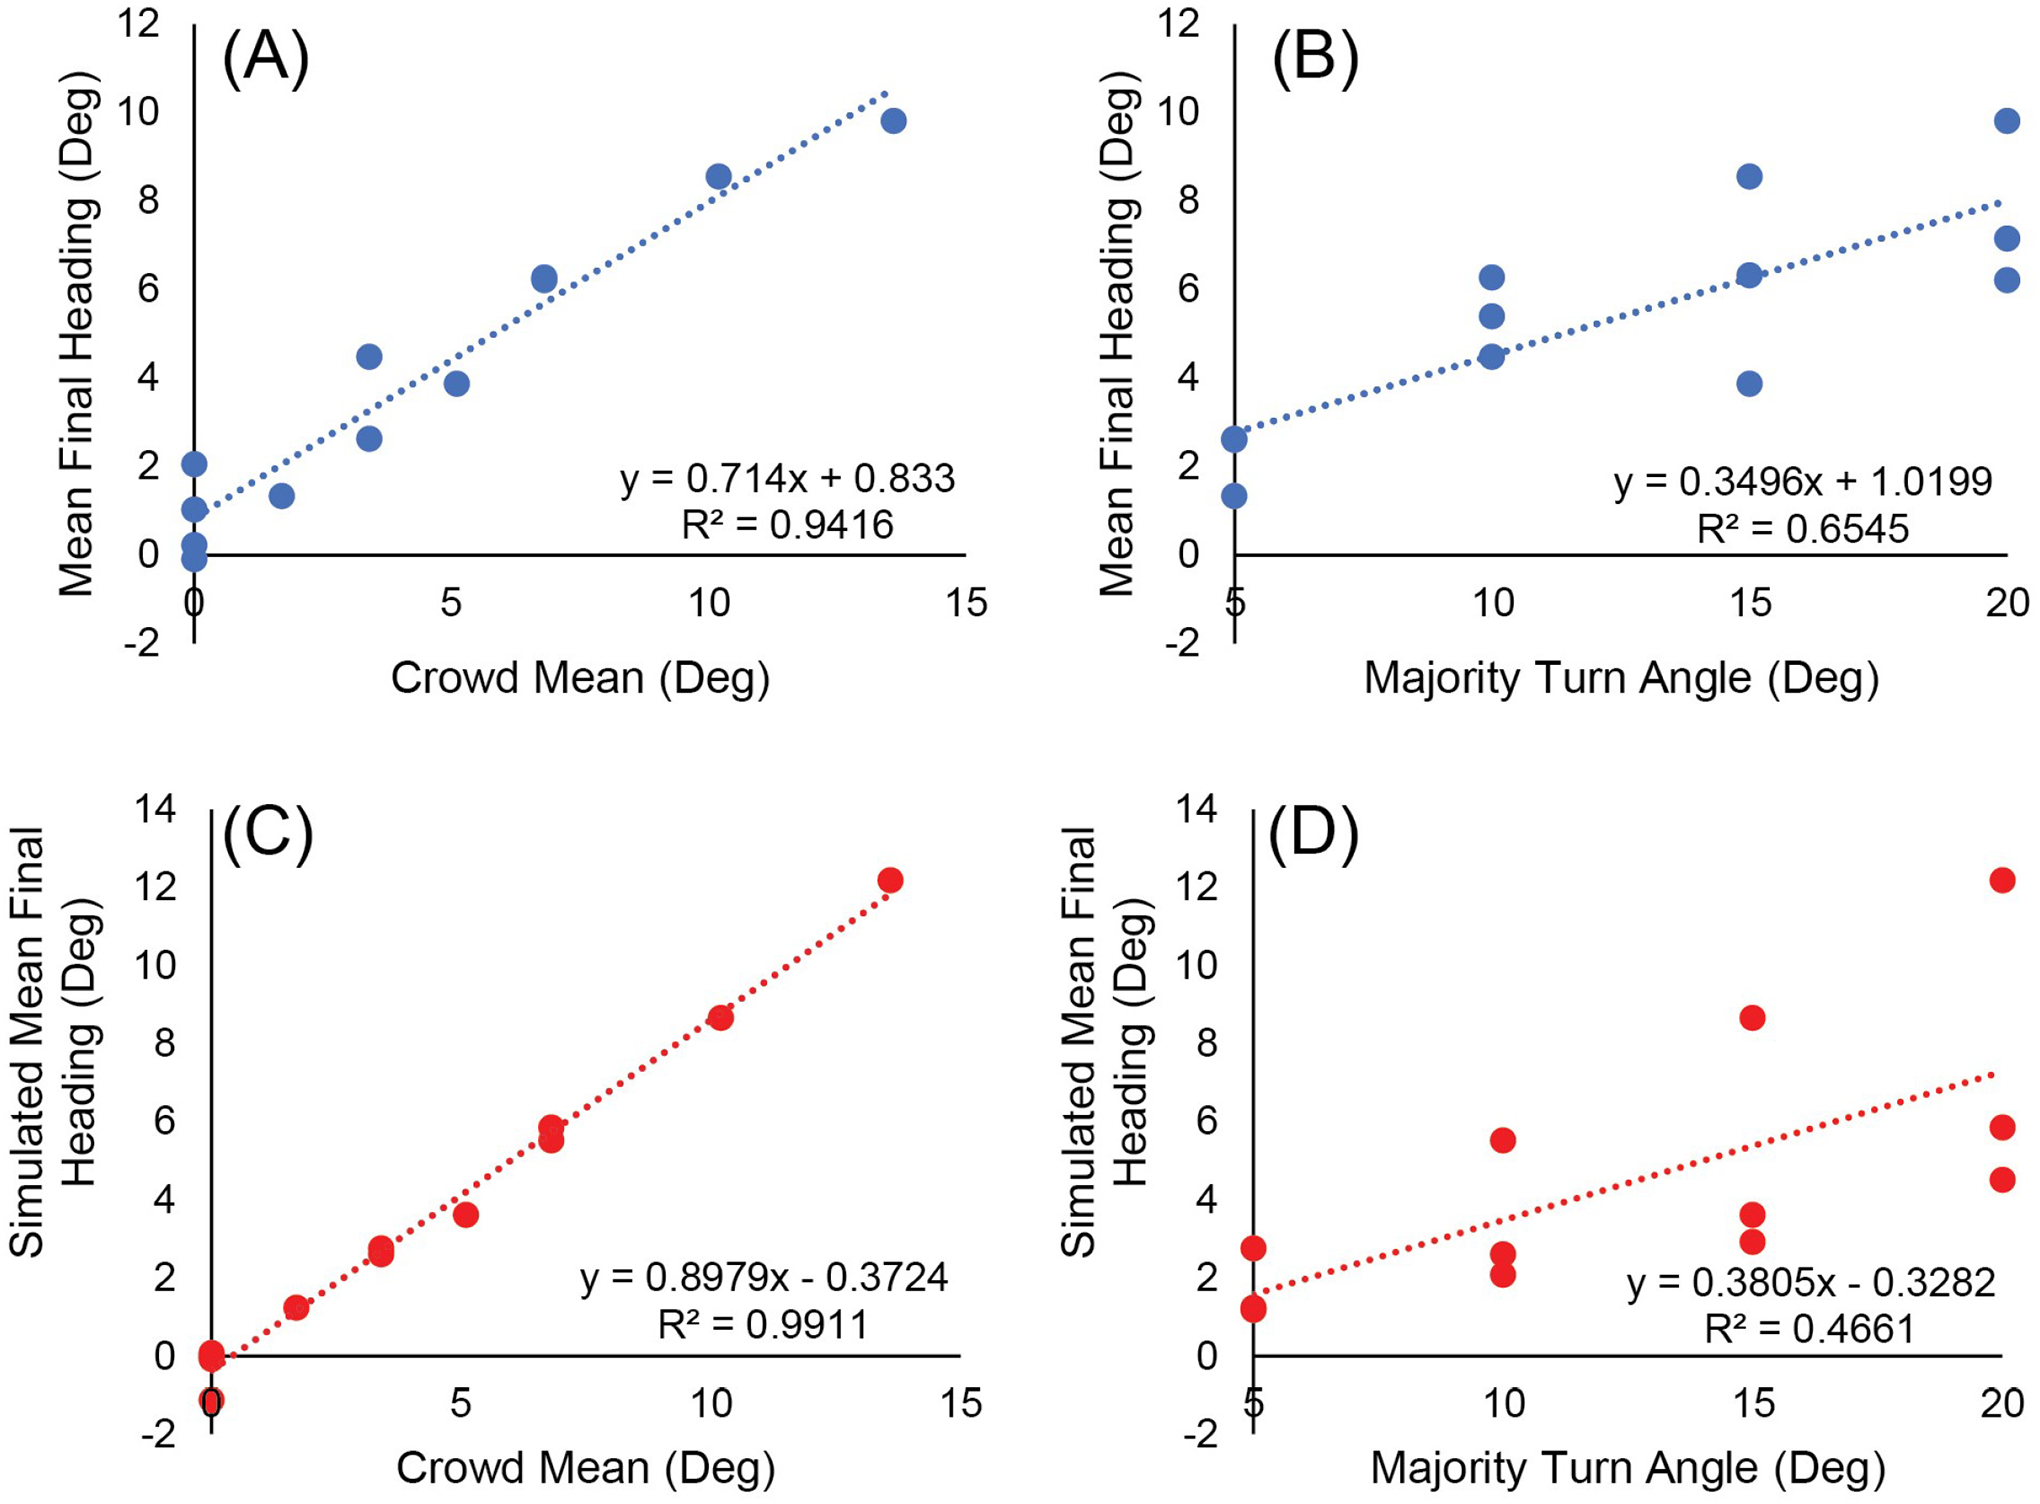
Figure 6.

Did participants follow the majority or the crowd average in Experiment 2? Linear regression of mean final heading on (A) the mean heading of the crowd or (B) the heading of the majority subgroup in each condition. (C, D) Corresponding linear regressions for simulations of the weighted-averaging model. Regression slopes and correlations (R2) on each panel indicate that final heading is much closer to the crowd mean than the majority for both humans and model.
