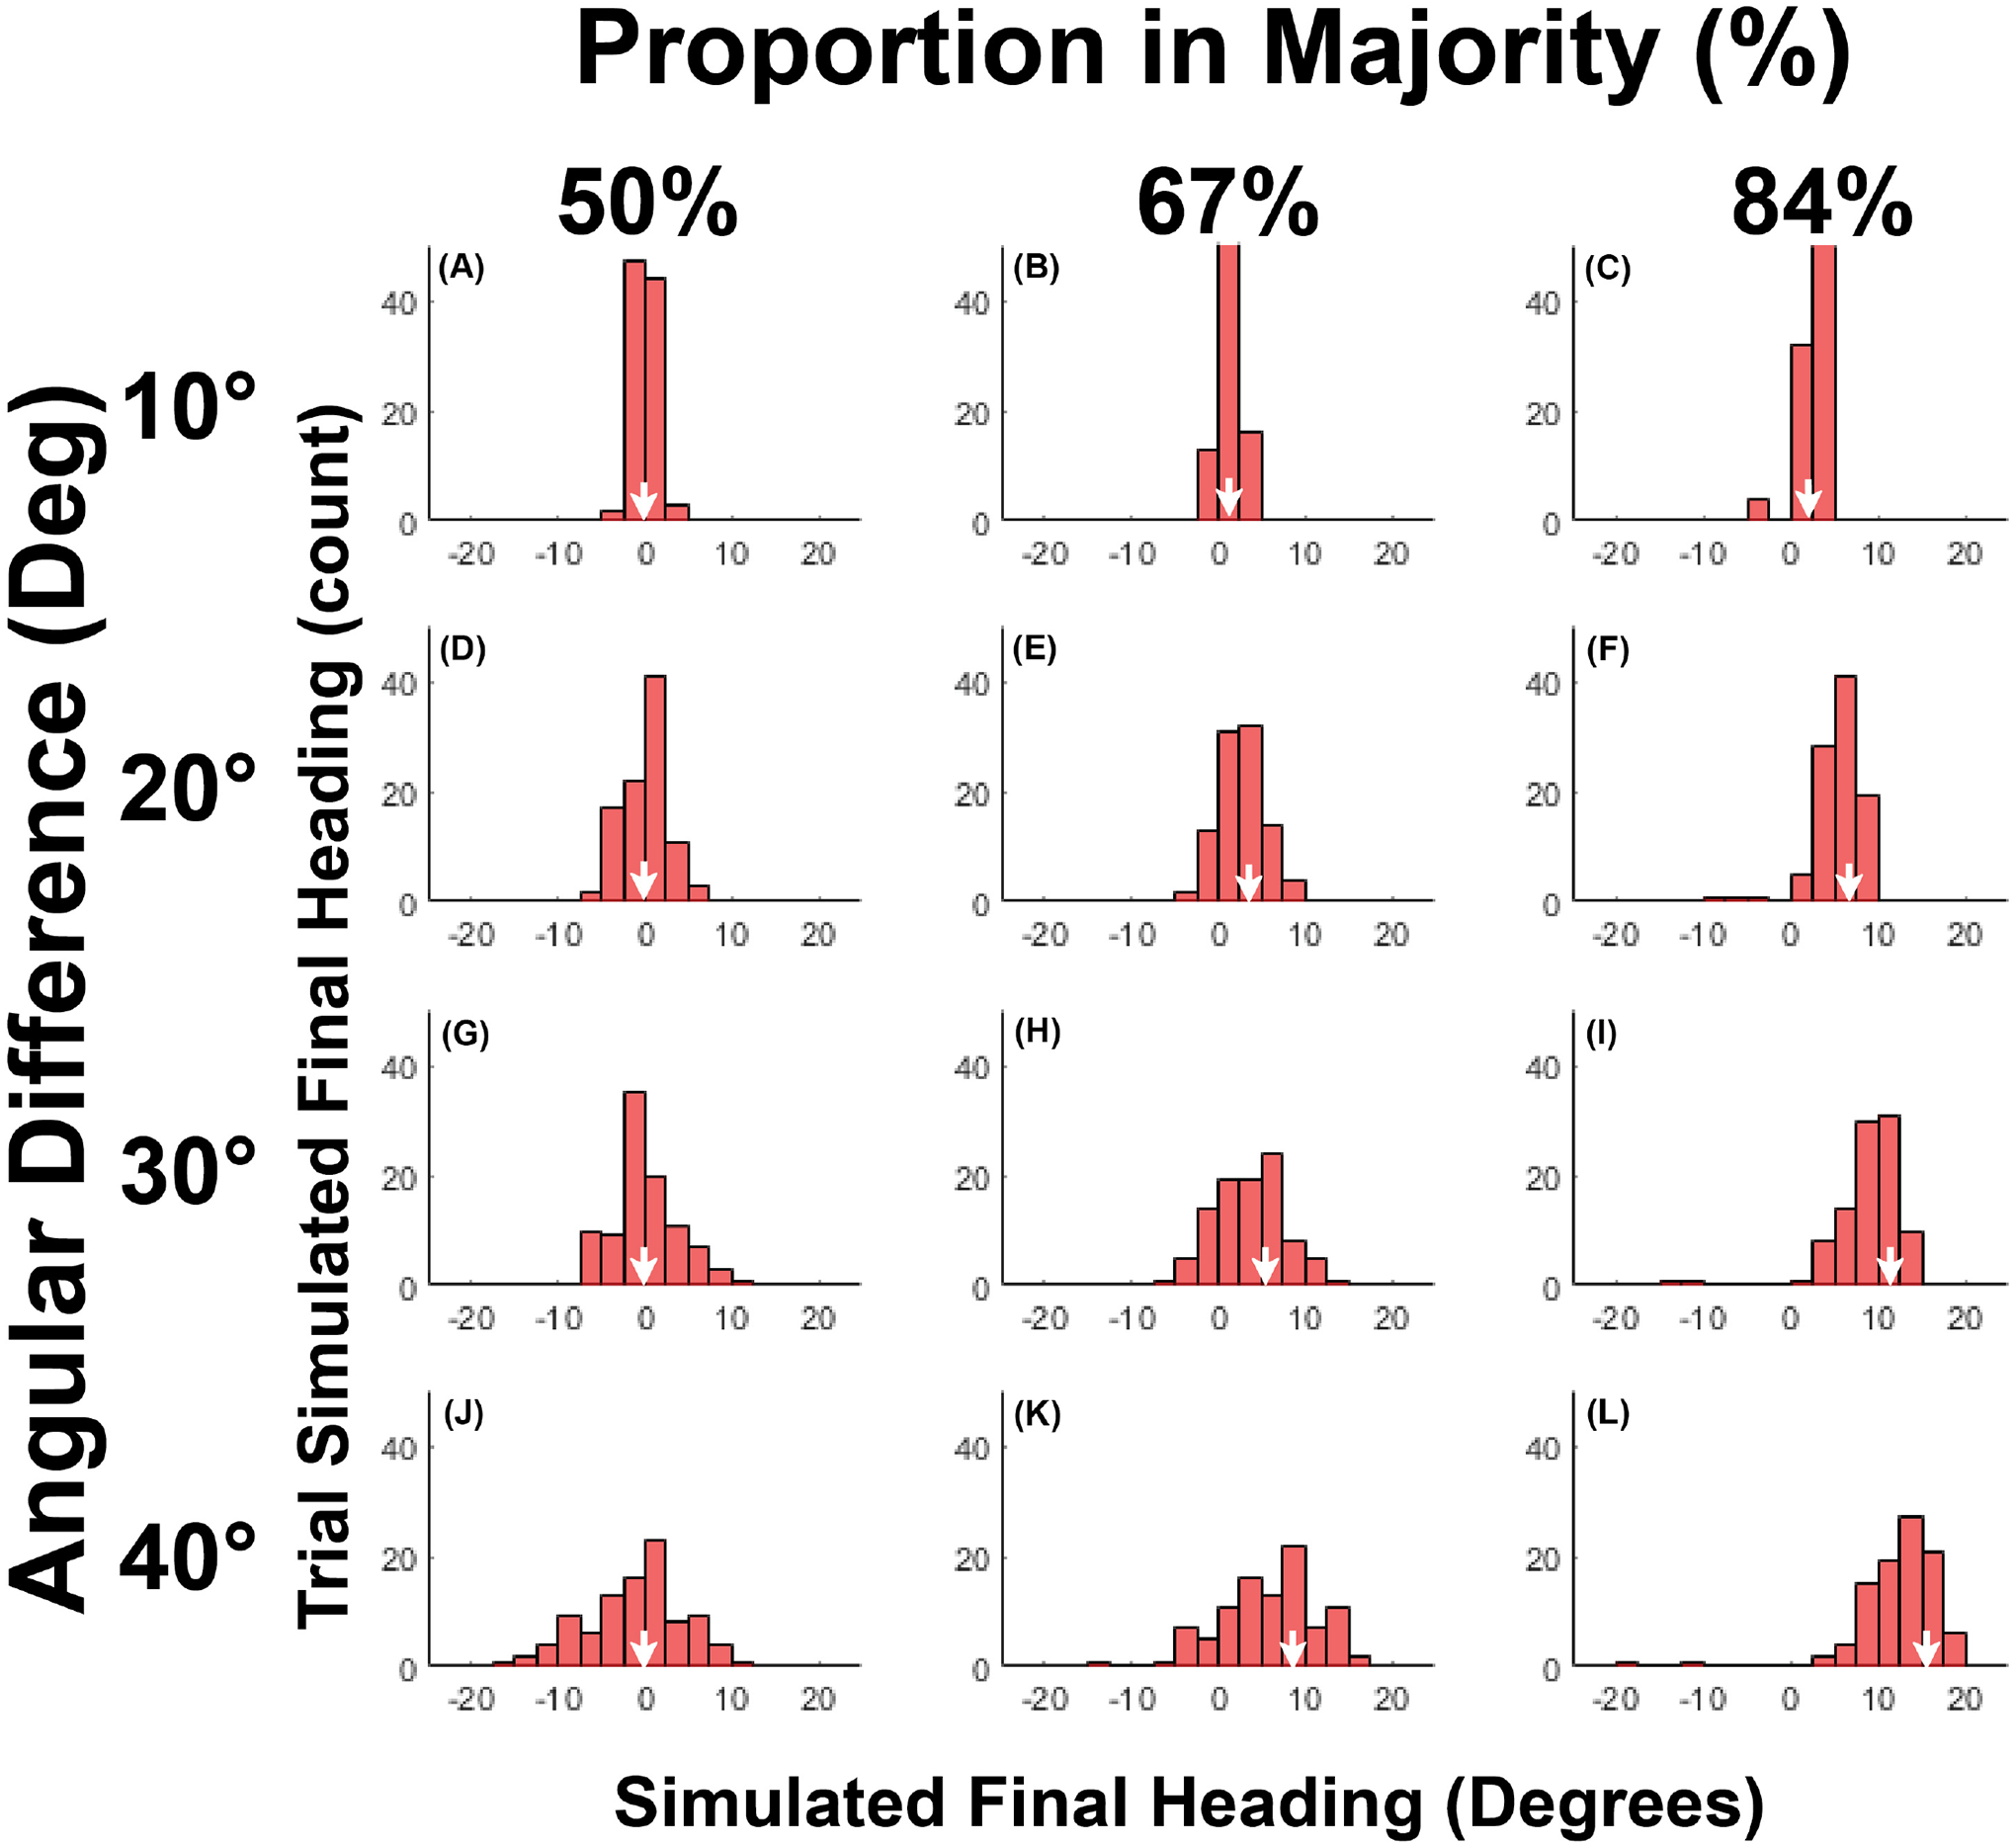
Figure 8.

Histograms of final heading for model simulations of Experiment 2. (A-L) Panels represent the frequency of final heading (2.5° intervals) for all simulated trials in each condition, same layout as Figure 4. Although the spread of the model histograms is narrower that the human histograms, the clustering about the crowd mean in each condition (white arrows) is quite similar.
