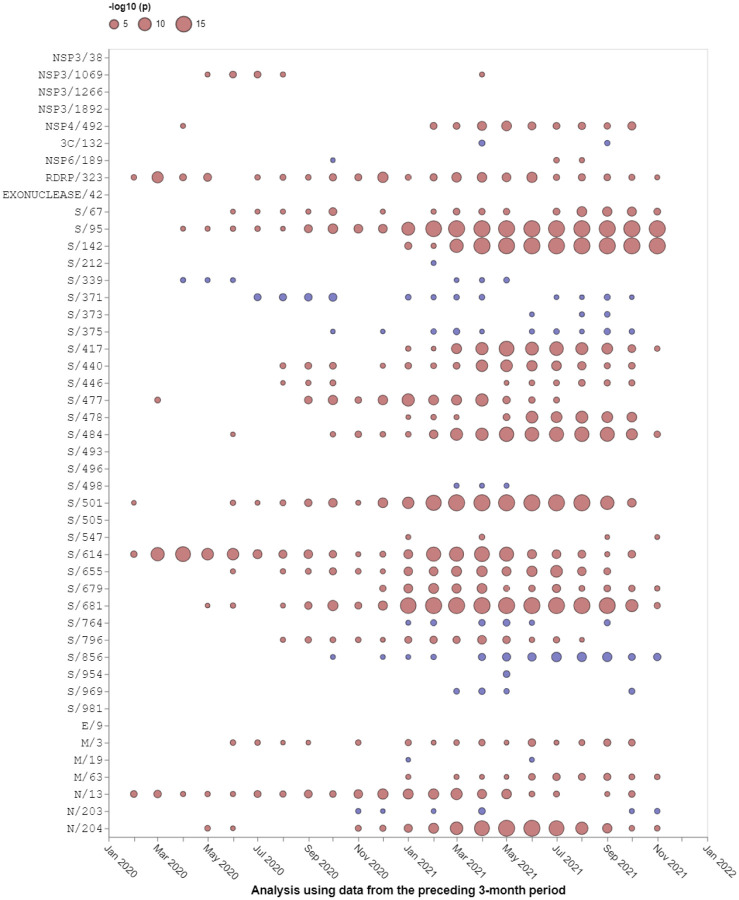
Figure 2. Selection signals that were evident at BA.1 amino acid change sites in other SARS-CoV-2 lineages prior to the emergence of Omicron.
All SARS-CoV-2 near full-length genome sequences present in GISAID12 on 21 November 2021 that passed various quality control checks were split up into three month sampling windows and analysed using the FEL method restricted to internal tree branches13 implemented in Hyphy 2.514. This method was also used in15. Red circles show sites under positive selection (selection favouring changes at amino acid states encoded at these sites). Blue circles show sites under negative selection (selection against non-synonymous changes). When no circle is shown, the corresponding site offered no statistical evidence for non-neutral evolution at a given time point. The areas of circles indicate the statistical strength of the selection signal (and not the actual strength of selection) within sequences sampled in the three months preceding the 1st day of the indicated months. Note that none of these analyses included any Omicron sequences, hence selection signals are derived solely from other SARS-CoV-2 lineages.

