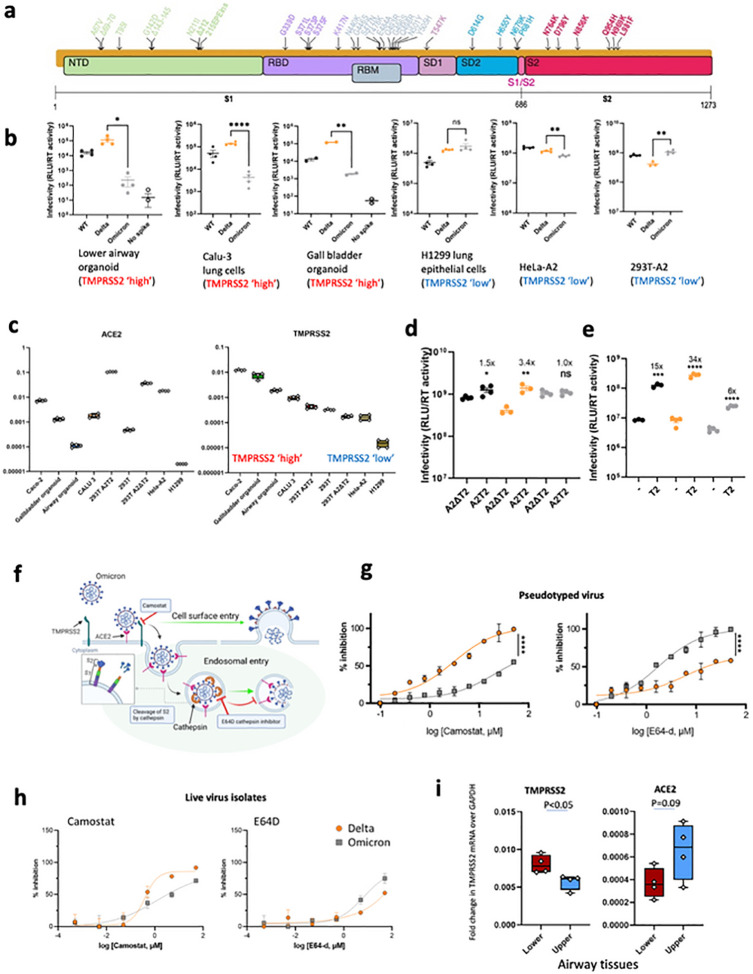
Figure 3: SARS-CoV-2 Omicron Variant spike enters ceils less efficiently by TMPRSS2 mediated plasma membrane fusion.
. a. Graphical representation of Omicron spike mutations present in expression plasmid used to generate lentiviral pseudotyped virus (PV). Mutations coloured according to location in spike; bold mutations are novel to this lineage and have not been identified in previous variants of concern (VOCs). b. PV entry in airway organoids, Calu-3 lung cells, gall bladded organoids, HI299 lung cells, HeLa-ACE2 overexpressing cells and HEK 293-ACE2 overexpressing cells. Black – WT Wuhan-1 D614G, Blue – Delta B.1.617.2, Green Omicron BA.1, c. mRNA transcripts for ACE2 and TMPRSS2 in indicated cell types and organoids as measured by qPCR. Samples were run in quadruplicate, d. Entry of PV expressing spike in 293T cells transduced to overexpress ACE2 and (i) depleted for TMPRSS2 (A2Δ T2) or (ii) overexpressing TMPRSS2 (A2T2). e. Entry of PV expressing spike in 293T cclls with endogenous (−) or overexpressed TMPRSS2 (T2). f. illustration of two cell entry pathways known to be used by SARS-CoV-2. g. Titration of inhibitors in A549-ACE2-TMPRSS2 (A549A2T2) cclls using PV expressing Delta (orange) or Omicron (grey) spike in the presence of the indicated doses of Camostat or E64d, then analysed after 48 hours. % inhibition was calculated relative to the maximum luminescent signal for each condition. For each variant and dilution, mean ± SEM is shown for an experiment conducted in duplicate. Data are representative of two independent experiments h. Titration of inhibitors in A549-ACE2-TMPRSS2 (A549A2T2)-based luminescent reporter cells using live virus. Cells were infected at MOI = 0.01 with Delta (orange) or Omicron (grey) variants in the presence of the indicated doses of Camostat or E64d, then analysed after 24 hours. % inhibition was calculated relative to the maximum luminescent signal for each condition. For each variant and dilution, mean ± SEM is shown for an experiment conducted in triplicate, i. ACE2 and TMPRSS2 mRNA expression by qPCR in human lung tissue (4 pieces of tissue each from upper and lower). Lower – Lung parenchyma Upper - main bronchus. One tissue sample from each region was tested in quadruplicate. *p<0.05, **p<0.01, ****p<0.0001. Data are representative of two independent experiments

