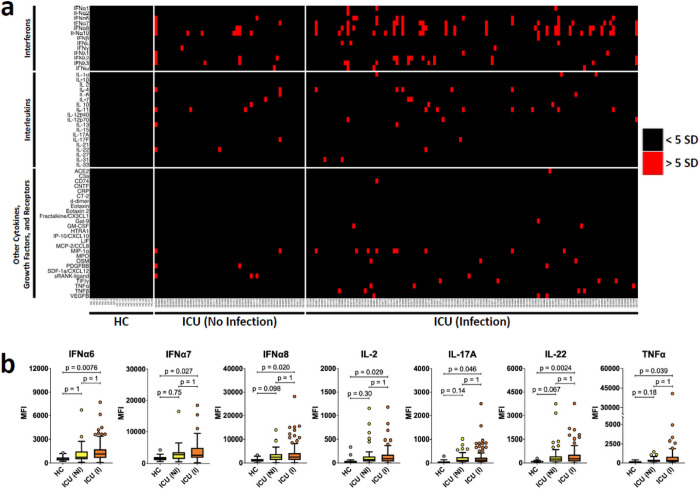
Figure 1. High prevalence of ACA in hospitalized ICU patients.
a Heatmap representing serum IgG ACA discovered using a 58-plex array of cytokines, chemokines, growth factors, and receptors. Stanford ICU patients who were infected with viruses, bacteria, fungi, or a combination of pathogens (n = 115), Stanford ICU patients with no evidence for infection (n = 52), and HC (n = 22) were analyzed for ACA. Cytokines are grouped on the y-axis by category (interferons, interleukins, and other cytokines/growth factors/receptors). Colors indicate ACA whose MFI measurements are > 5 SD (red) or < 5 SD (black) above the average MFI for HC. MFIs <3,000 were excluded. b Tukey box plots comparing MFI data from HC and Stanford ICU patients for the seven antigens for which statistically significant differences were determined between patient groups using two-tailed Wilcoxon rank-sum tests with Bonferroni correction. The middle line represents the median, while the lower and upper hinges correspond to the first and third quartiles. The upper whisker extends from the hinge to 1.5 times the interquartile range (IQR) above the 75th percentile MFI value, and the lower whisker extends from the hinge to 1.5 times the IQR below the 25th percentile MFI value.

