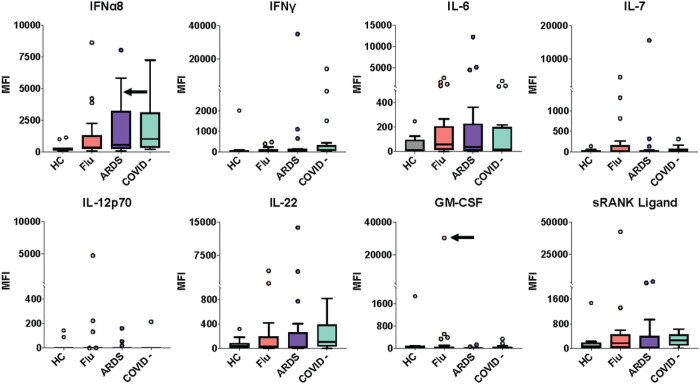
Figure 2. IgG anti-cytokine autoantibodies in serum from ARDS patients or patients acutely infected with influenza virus.
Tukey box plots comparing MFI data for eight cytokines in influenza patients (n = 25) and ARDS patients (n = 17), both collected prior to the COVID-19 pandemic; ARDS patients who were COVID-19- (n = 19); and HC (n = 11). The middle line represents the median, while the lower and upper hinges correspond to the first and third quartiles. The upper whisker extends from the hinge to 1.5 times the interquartile range (IQR) above the 75th percentile MFI value, and the lower whisker extends from the hinge to 1.5 times the IQR below the 25th percentile MFI value. Black arrows indicate a serum sample with receptor blocking activity (see Fig. 3). Individual MFI values 1.5 times the IQR above the 75th percentile or 1.5 times the IQR below the 25th percentile are displayed as dots. MFI is shown on the y-axis, which is hatched to reflect outlier samples with relatively high MFI. Cohorts are shown on the x-axis.

