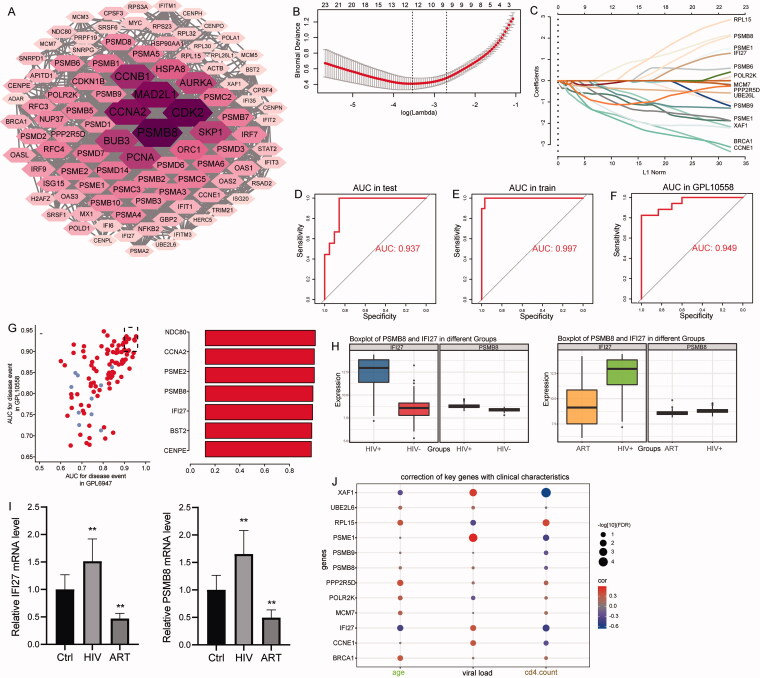
Figure 5.
PPI network analysis of module genes identifies key genes. (A). Top 100 most connected genes in the PPI network. The larger the node, the greater the degree. (B). Selection of optimal parameter (λ) in the LASSO model. The log(λ) value of 12 is used for further analysis. (C) LASSO coefficient profiles of 12 signature genes. (D) AUC values of the signature genes in the training set. (E) AUC values of the signature genes in the validation set. (F) AUC values of the signature genes in GPL10558. (G) AUC values of important genes. (H) Expression levels of PSMB8 and IFI27 in ART or HIV-positive individuals of GPL6947. (I) Relative expression levels of PSMB8 and IFI27 in blood samples of controls, HIV-positive individuals, and ART patients detected by qRT-PCR. **p Value <.01. Ctrl: controls; ART: antiretroviral therapy. (J) Correlations between key genes and clinical features.

