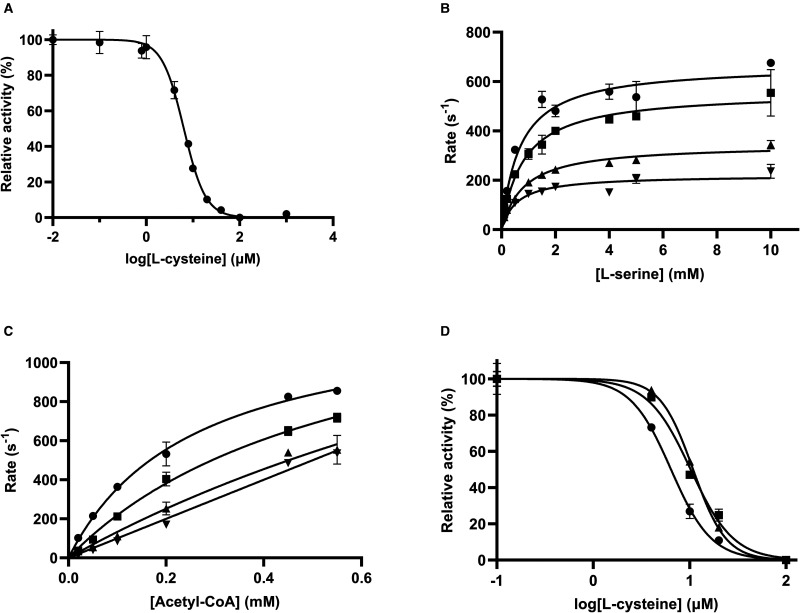
Figure 6. Characterization of cysteine inhibition.
(A) Dose response curve for l-cysteine. Line represents the fit of IC50 equation to data. Substrate concentrations were fixed at 0.15 mM and 1.5 mM, for acetyl-CoA and l-serine, respectively. (B) Michaelis–Menten plots were collected for 0 (circles), 4 (squares), 6 (triangles) and 8 (inverted triangles) µM of l-cysteine, with varying concentrations of serine. (C) Michaelis–Menten plots for 0 (circles), 4 (squares), 6 (triangles) and 8 (inverted triangles) µM of l-cysteine, with varying concentrations of acetyl-CoA (x-axis). (D) Dose–response curves for l-cysteine in the presence of 0.15 (circles), 0.25 (squares) and 0.45 (triangles) mM of acetyl-CoA. Data points are mean and error bars are SEM derived from two replicates.

