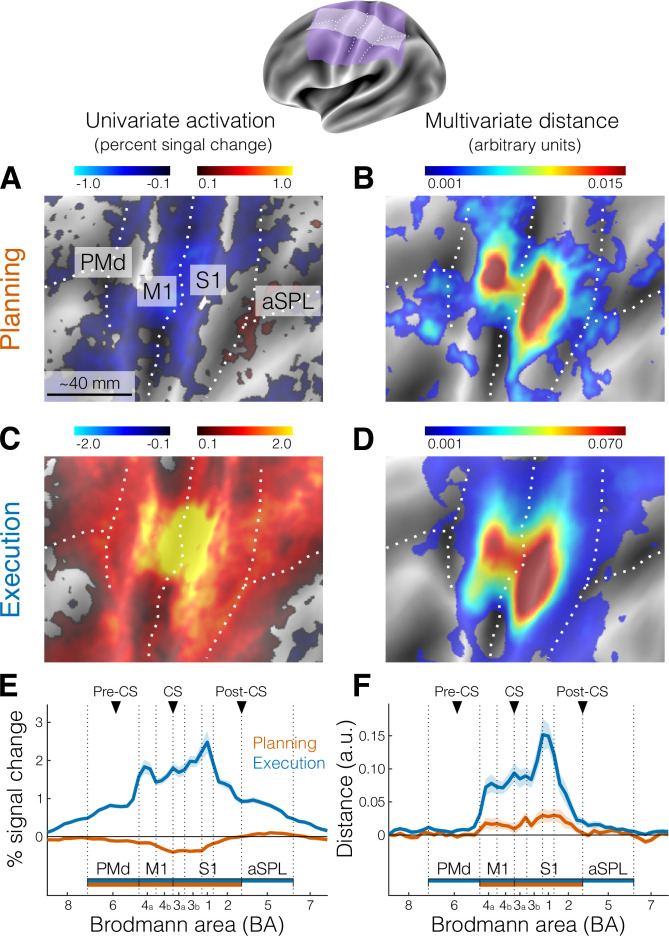
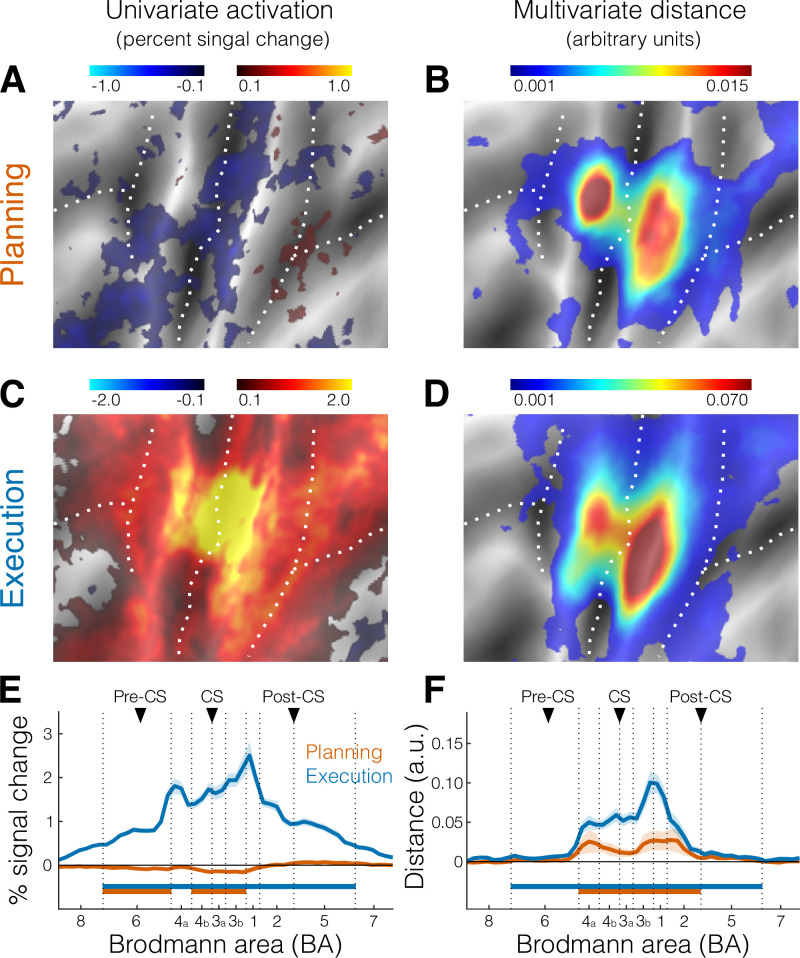
Figure 2. Activation and distance analyses of movement planning and execution.
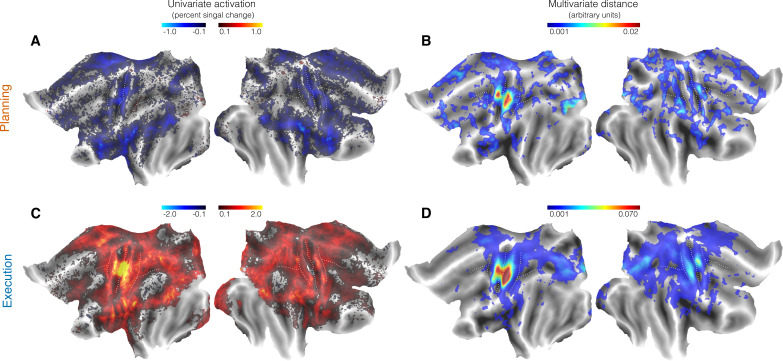
The inset shows the inflated cortical surface of the contralateral (left) hemisphere, highlighting the area of interest (A-D, purple) and the strip used for the profile region of interest (ROI) analysis (E, F, white). Major sulci are indicated by white dotted lines.( A) Univariate activation map (percent signal change) for the contrast planning > baseline (no-go trials only). (B) Multivariate searchlight map of the mean crossnobis distance between the planning of the three fingers (no-go trials only). (C) Same as A, but for the univariate contrast execution > baseline (go trials). (D) Same as B, but for the mean crossnobis distance between fingers during execution. Colorbars in A and C reflect mean percent signal change, whereas colorbars in B and D reflect mean crossnobis distance (arbitrary units). (E) Profile ROI analysis (see Materials and methods) of the mean percent signal change (± standard error of the mean [SEM]) during planning (no-go trials, orange) and execution (blue). The x-axis corresponds to Brodmann areas (BAs) selected from the white strip shown in the inset at the top. Horizontal bars indicate significance (p < 0.05) in a two-sided one-sample t-test vs zero for selected ROIs. (F) Same as E, but for the mean crossnobis distance (± SEM). Vertical dotted lines mark the approximate boundaries between BAs subdivisions of our main ROIs (see Materials and methods). Black triangles point to the approximate location of the main anatomical landmarks: Pre-CS = precentral sulcus; CS = central sulcus; Post-CS = postcentral sulcus. PMd (BA 6) = dorsal premotor cortex; M1 (BA 4a, 4b) = primary motor cortex; S1 (BA 3a, 3b, 1, 2) = primary somatosensory cortex; aSPL (BA 5) = anterior superior parietal lobule. For analogous results using the estimates of planning activity from all trials, see Figure 2—figure supplement 1. For the whole-brain maps of univariate and multivariate results, see Figure 2—figure supplement 2.


