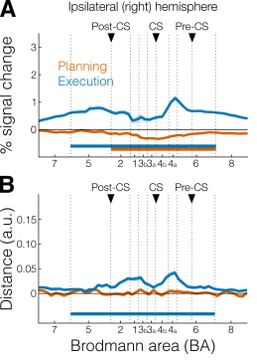
Author response image 2. A.

Profile ROIs analysis of activation (mean percent signal change) in the ipsilateral (right) hemisphere for planning (orange) and execution (blue). Vertical dotted lines denote boundaries of ROI subdivisions. Black triangles denote the three main sulci in the right hemisphere: postcentral sulcus (post-CS), central sulcus (CS), and precentral sulcus (pre-CS). Horizontal bars indicate significance (p < 0.05) in a 2-sided one-sample t-test vs zero. B. Same as A but for multivariate crossnobis distance.
