. 2022 Jan 10;11:e74057. doi: 10.7554/eLife.74057

Figure 2. Learning curve of Experiment 1: lines graph show the percentage of correct choices for each archerfish in a 3 vs 6 training, grouped by numerosity rewarded (three or six dots).

Learning criterion (blue dotted line) was reached after two consecutive sessions ≥75%. The red dotted line refers to chance level.

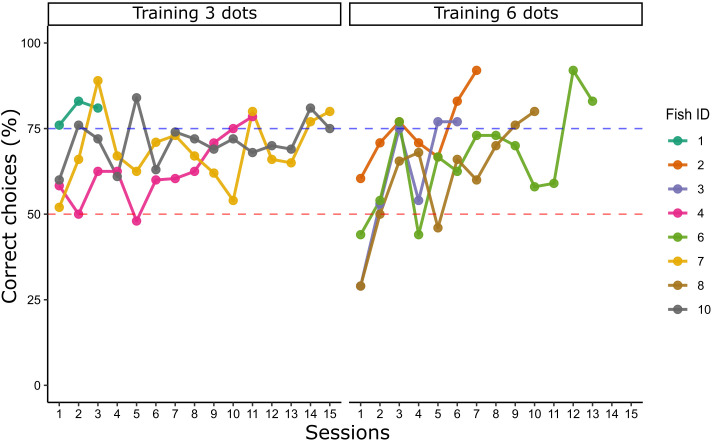
Figure 2.

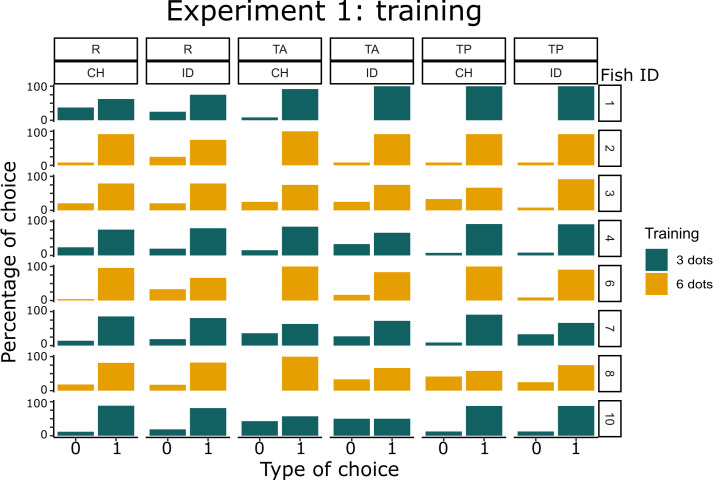
Figure 2—figure supplement 1. Performance data for each non-numerical control condition at training in Experiment 1.

Figure 2—figure supplement 1.

Type of choices 0 and 1 corresponds to uncorrect and correct choices, respectively (training data refer to the last two training sessions, when learning criterion was reached).