. 2022 Jan 10;11:e74057. doi: 10.7554/eLife.74057

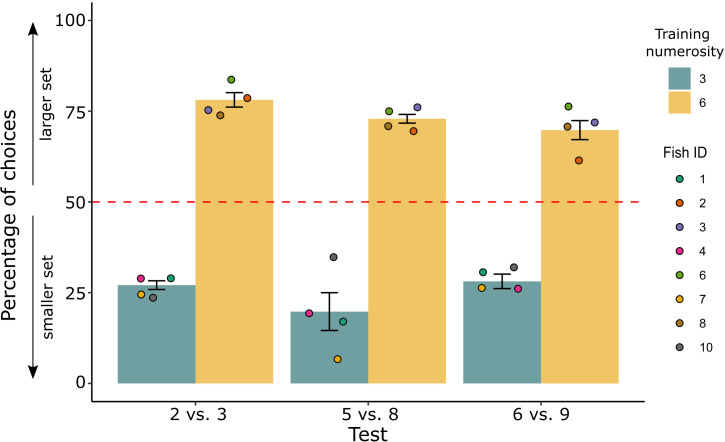
Figure 3. Percentage of choice for the larger/smaller set (mean ± standard error of the mean [SEM]) in the comparison tests for the two groups trained to select the smaller (3) or larger (6) set.

Coloured dots represent the individual performance for each fish.

Figure 3.

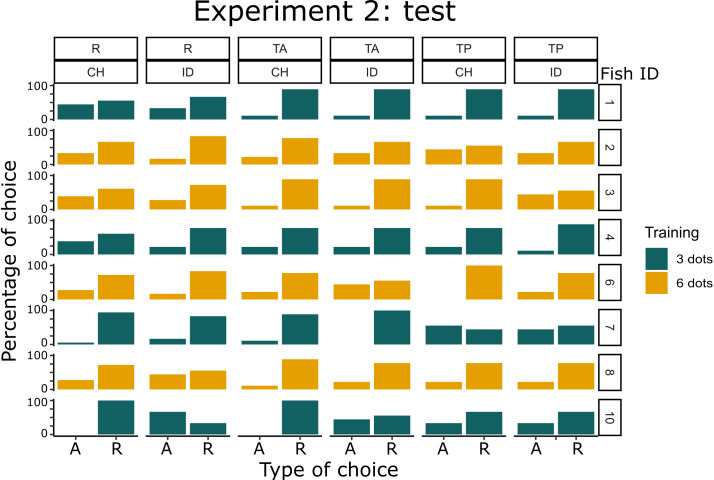
Figure 3—figure supplement 1. Individual performance data for each non-numerical control condition at test in Experiment 1.

Figure 3—figure supplement 1.

Type of choices A and R corresponds to choices for absolute and relative numerosity.