. 2021 Dec 23;10:e71612. doi: 10.7554/eLife.71612

Figure 3. Single neuron and population dynamics in measurement and reproduction.

(A) Normalized (z-scored) spike density functions (SDFs) of all 1766 medial prefrontal cortex (mPFC) neurons for each stimulus interval during the measurement phase sorted by their timing within the intervals. Small panel: matrix of pairwise Pearson correlations between all neurons. Diagonal entries not plotted. (B) Same as (A) but for the reproduction phase. (C) Same as (B) but with neurons sorted as in (A). (D) Population vector correlations in corresponding time bins of measurement and reproduction. (E) Pearson correlations between measurement and reproduction for single neurons. (F) Pairwise correlations of the whole population for different stimuli in measurement (F1) and reproduction (F2). Diagonal entries not plotted. (G) Distributions of average Pearson correlations of single-cell activity for different stimuli in measurement (G1) and reproduction (G2). Histograms in (D, E, G) are displayed in gray with significant values (p<0.05) delimited by an orange outline. Pie plots show significant (orange) and nonsignificant (blue) percentages.

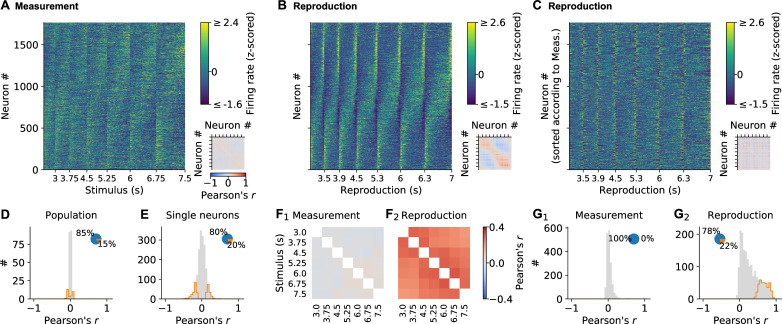
Figure 3—source data 1. Spike density function (SDF) source data for Figure 3A and B and all upcoming analyses and figures based on SDFs.
The zip also includes Python source code to load the hdf5 data.

Figure 3.

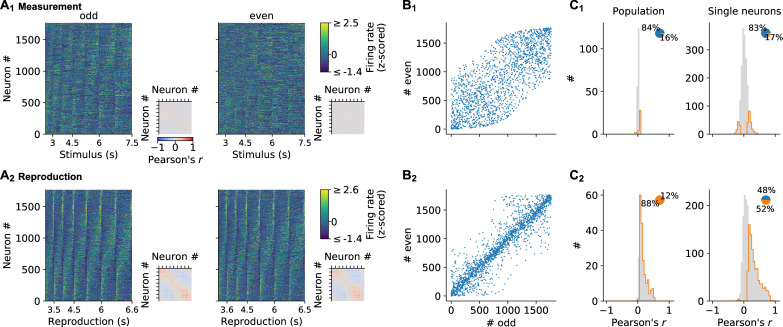
Figure 3—figure supplement 1. Stability of neuronal responses.

Figure 3—figure supplement 1.

(A) Normalized (z-scored) spike density functions (SDFs) of all neurons for each stimulus interval during (A1) measurement and (A2) reproduction sorted by their timing within the intervals for odd trials; same sorting in (A1) and (A2). The left side displays data for odd trials only; the right panel for even trials. Small panels: matrices of pairwise Pearson correlations between all neurons. Diagonal entries not plotted. (B) Sorting indices assigned to the neurons if sorting would be based only on activity during odd or even trials. The closer a dot appears at the bisecting line, the better sorting corresponds between odd and even trials. During reproduction, activity corresponds well, arguing for stable responses throughout a recording session. During measurement activity is less similar. This has to be attributed to less pronounced and noisier responses in this task phase and not unstable recordings since measurement and reproduction are interleaved throughout the session. (C) Correlations between odd and even trials give a similar picture. Histograms plot Pearson’s correlation coefficients during (C1) measurement and (C2) reproduction of the population in each time bin (left) and for single neurons (right). Histograms are displayed in gray with significant values delimited by an orange outline (p<0.05). Pie plots show significant (orange) and nonsignificant (blue) percentages.