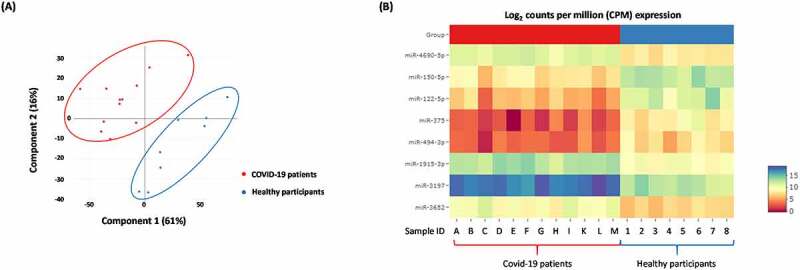
Figure 1.

Differentially expressed 1018 miRNAs in COVID-19 patients with moderate-severe disease compared to healthy participants. (A) Principal component analysis (PCA) plot showing transcriptome differences between miRNA expression in COVID-19 patients compared to healthy participants. Each dot represents one of the total number of samples (12 samples from COVID-19 patients and 8 samples from healthy participants) used in the sequencing-based screening. (B) Heat map showing the expression of specific miRNAs in COVID-19 patients compared to healthy participants. The red and blue colours indicate up-regulation (log2 [2.5]) and down-regulation (log2 [−2.5]), respectively as shown in the colour bar.
