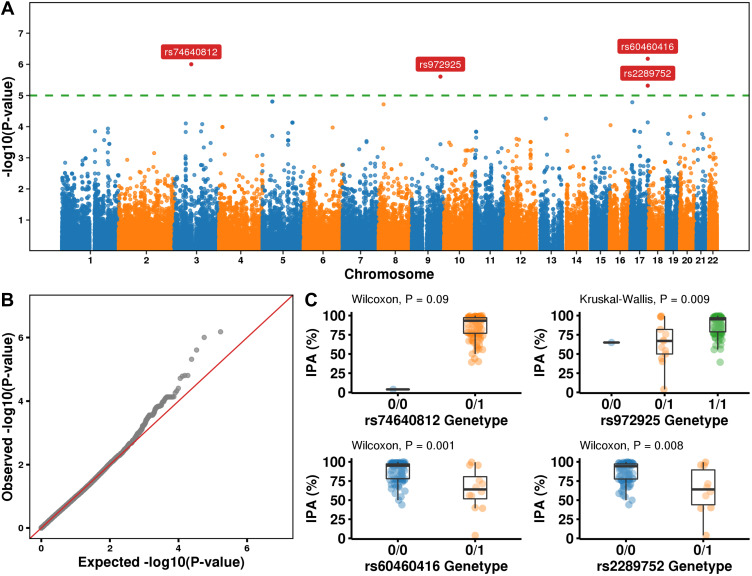
Figure 4.
Whole-exome association study with IPA. (A) Manhattan plots showing ACS susceptibility loci discovered in the Chinese ACS WES dataset. Horizontal lines represent the genome-wide threshold (P = 1.2 × 10⁻⁵, green). The 4 sites that survived the genome-wide threshold with gene symbols marked in the plot. (B) Q-Q plot. (C) The distribution of IPA in different SNP variation types. 0/0 None, 0/1 heterozygous, 1/1 homozygous variant.

