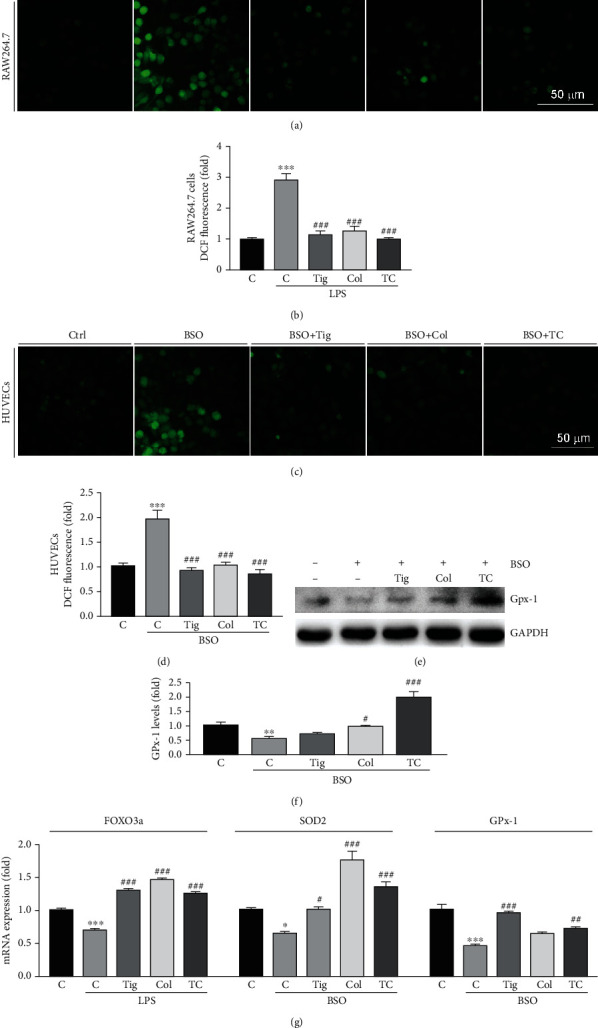
Figure 4.

Colchicine inhibits ROS production in HUVECs and RAW264.7 cells by increasing antioxidant enzyme expression. (a–d) RAW264.7 cells were treated with ticagrelor (10 μM), colchicine (100 ng/mL), or ticagrelor plus colchicine in the presence of LPS (500 ng/mL) for 24 h (a, b); HUVECs were treated with ticagrelor (10 mM), colchicine (100 ng/mL), or ticagrelor plus colchicine in the presence of BSO (10 μM) overnight (c, d). After treatment, ROS levels were determined by a Zeiss microscope (a, c) or using a fluorescence microplate reader (b, d); (e–g) HUVECs were treated with ticagrelor (10 mM), colchicine (100 ng/mL), or ticagrelor plus colchicine in the presence of BSO (10 mM) for 24 h. Expression of GPx-1 and GAPDH was determined by Western blot (e) with quantitation of band density (f). Expression of FOXO3a, SOD2, and GPx-1 mRNA was determined by qRT-PCR (g). ∗P < 0.05, ∗∗P < 0.01, and ∗∗∗P < 0.001 vs. control; #P < 0.05, ##P < 0.01, and ###P < 0.001 vs. LPS or BSO treated group (n = 3).
