Figure 13.

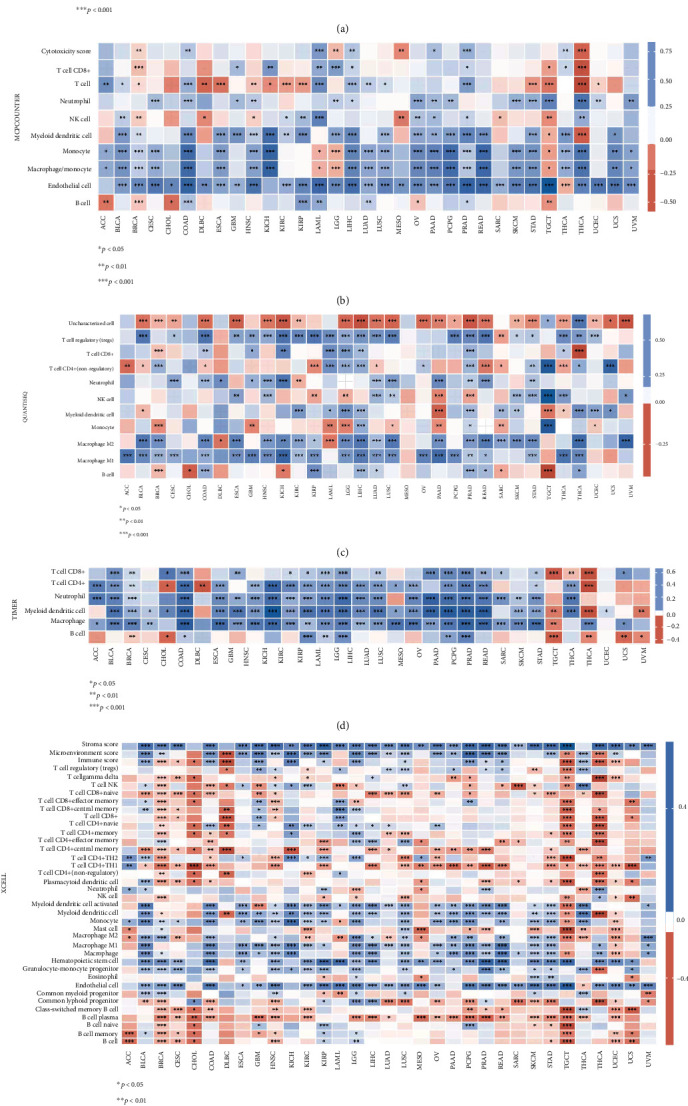
Heat map showing the correlations of COL5A1 expression with TIIC based on EPIC (a), MCP-counter (b), quanTIseq (c), TIMER (d), and xCell (e) algorithm.

Heat map showing the correlations of COL5A1 expression with TIIC based on EPIC (a), MCP-counter (b), quanTIseq (c), TIMER (d), and xCell (e) algorithm.