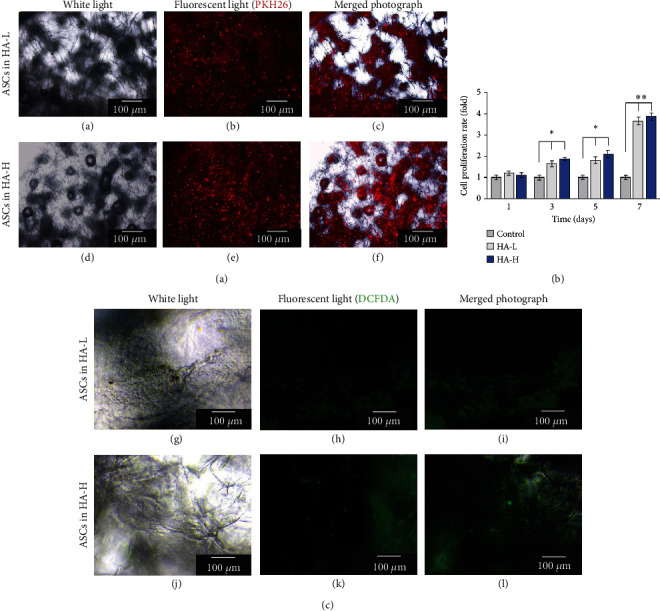
Figure 3.

(a) View of cultured ASCs within two types of matrices under a fluorescence microscope. (A) and (D): The left column images were viewed under the white light. (B) and (E): The middle column images were viewed under the red fluorescence microscope. (C) and (F): The right column images were merged photographs of the first and second column ones (bar =100 μm). (b) Steady enhancements of the cell proliferation rates for the vehicle control and HA-L and HA-H matrices. ASCs showed higher values cultured in HA-H matrix than in the HA-L one within a 7-day period culture. (c) The DCFDA assay results presented that HA-H matrix decreased ROS production in oxidative stress property assay. The photo representing order sequence (G)–(L) was similar as part demonstration (A)–(F). Each value was represented as the mean values ± SD (n = 3). The level of significance is designated as ∗p < 0.05 and ∗∗p < 0.01.
