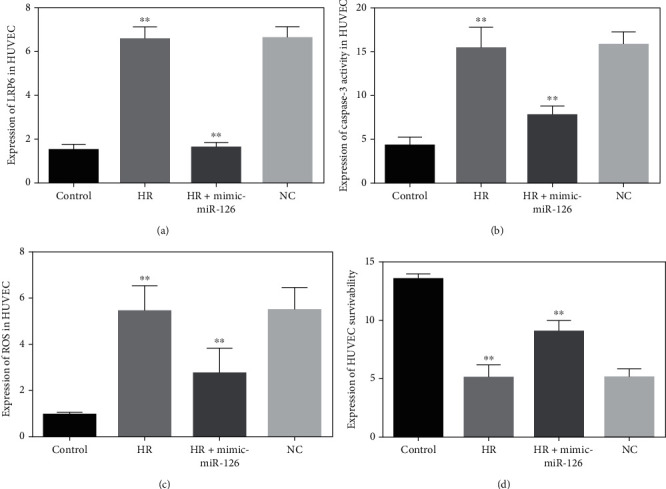
Figure 5.

(a) LRP6 expression levels in normal, 18-hour HR, HR treated with mimic-miR-126, and NC groups in HUVECs. (b) Capase-3 expression between normal versus HR, HR versus HR plus mimic-miR-126, HR, and miR-126 NC groups in HUVECs. (c) Intracellular ROS concentrations in HUVECs between control and HR, HR, and HR transfected with mimic-miR-126, NC, and HR groups. ∗∗P < 0.001.
