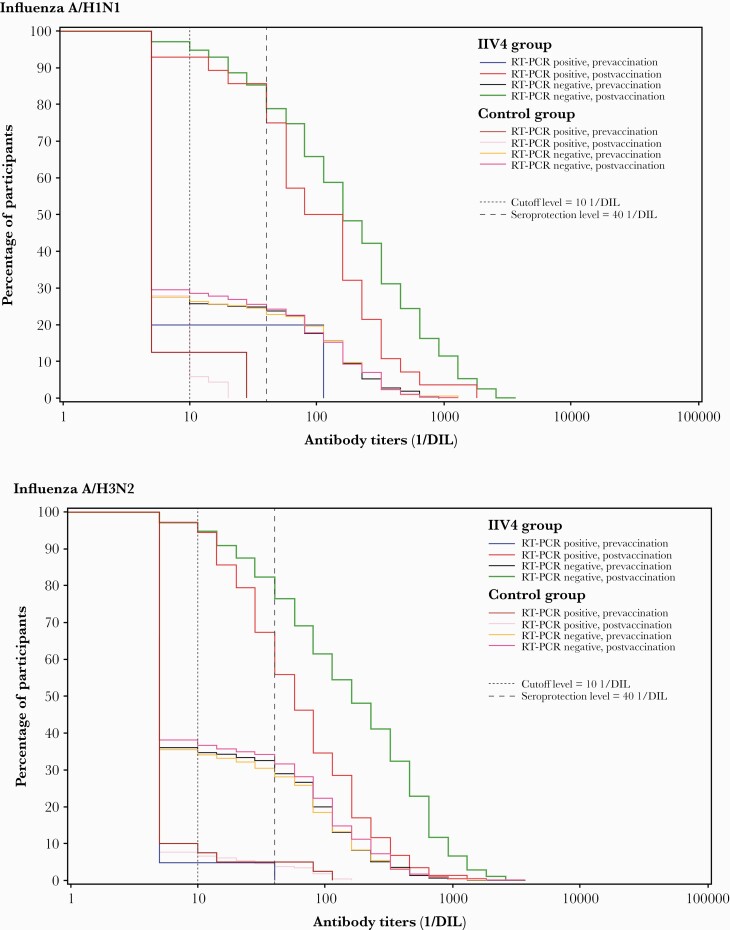
Figure 2.
Reverse cumulative distribution curves for hemagglutination inhibition (HI) antibody titers in children with or without reverse-transcription polymerase chain reaction (RT-PCR)–confirmed influenza illness at 28 days after final vaccination (per-protocol correlate of protection cohort). The green line shows postvaccination HI titers in inactivated quadrivalent influenza vaccine (IIV4)–vaccinated children who did not experience RT-PCR–confirmed influenza illness. The red line shows postvaccination HI titers in IIV4-vaccinated children with RT-PCR–confirmed influenza illness. The bright pink line shows postvaccination HI titers in unvaccinated (control) children who did not experience RT-PCR–confirmed influenza illness. The pale pink line shows postvaccination HI titers in unvaccinated (control) children with RT-PCR–confirmed influenza illness. The other lines show prevaccination HI titers. The dotted lines show the assay cutoff level (titer ≥10 1/dilution [DIL]) and the level defined in the study protocol as seroprotective (titer ≥40 1/DIL).

