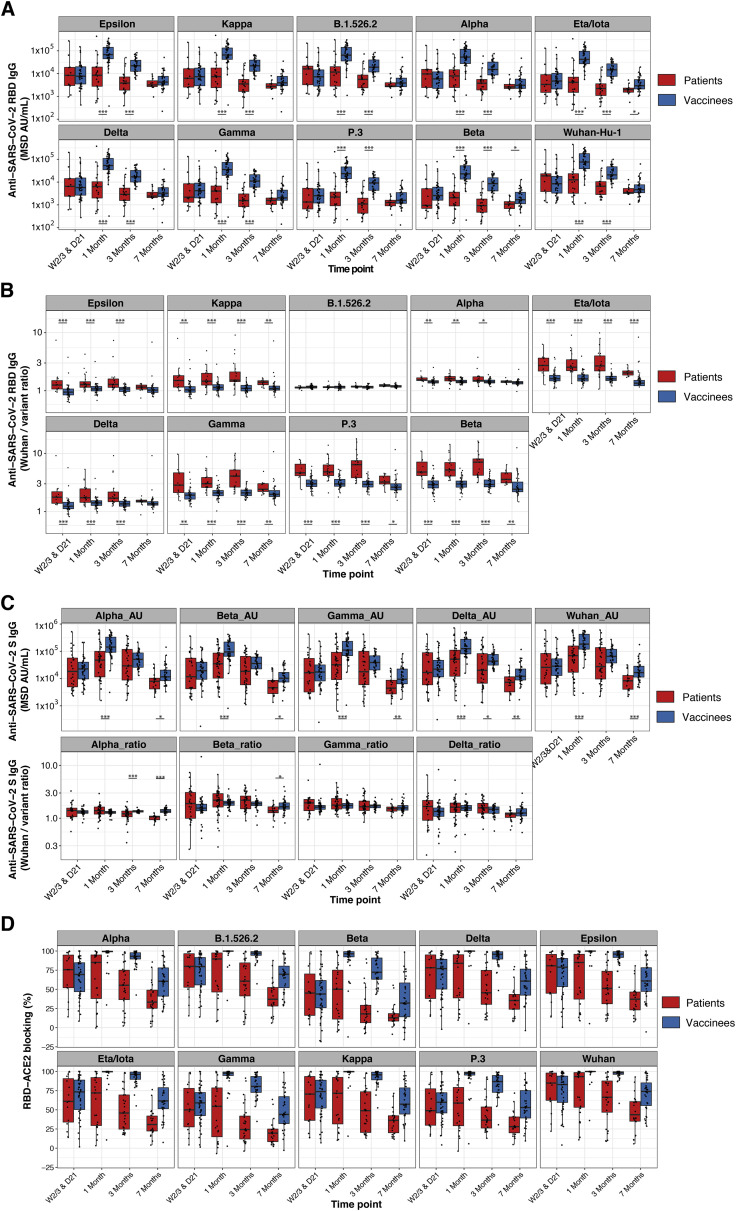
Figure S4.
Greater breadth of IgG binding to SARS-CoV-2 variant RBDs following BNT162b2 vaccination compared with infection with Wuhan-Hu-1 SARS-CoV-2 (validation cohort), related to Figure 3
(A and B) Anti-SARS-CoV-2 Wuhan-Hu-1 and viral variant RBD IgG responses are shown for Stanford individuals who received BNT162b2 vaccination and for Wuhan-Hu-1-infected COVID-19 Stanford patient cohort 2 at different time points after vaccination/COVID-19 symptom onset. Box-whisker plots show the interquartile range as the box and the whisker ends as the most extreme values within 1.5 times the interquartile range below the 25% quantile and above the 75% quantile. Significance between groups was tested with two-sided Wilcoxon rank sum test. ∗p < 0.05, ∗∗p < 0.01, ∗∗∗p < 0.001.
(A) Anti-RBD IgG concentrations.
(B) Ratios of anti-Wuhan-Hu-1 to variant RBD IgG concentration.
(C) Anti-SARS-CoV-2 Wuhan-Hu-1 and viral variant spike IgG responses as anti-spike IgG concentrations (upper panels) and as ratios of anti-Wuhan-Hu-1 to variant spike IgG concentration (lower panels) are shown for Stanford individuals who received BNT162b2 vaccination and for Wuhan-Hu-1-infected COVID-19 Stanford patient cohorts 1 and 2 samples. Box-whisker plots show the interquartile range as the box and the whisker ends as the most extreme values within 1.5 times the interquartile range below the 25% quantile and above the 75% quantile. Significance between groups was tested with two-sided Wilcoxon rank sum test. ∗p < 0.05, ∗∗p < 0.01, ∗∗∗p < 0.001.
(D) Percentage blocking of ACE2 binding to RBD of specified viral variants by plasma antibodies of BNT162b2 vaccinees and Stanford patient cohort 2 samples.

