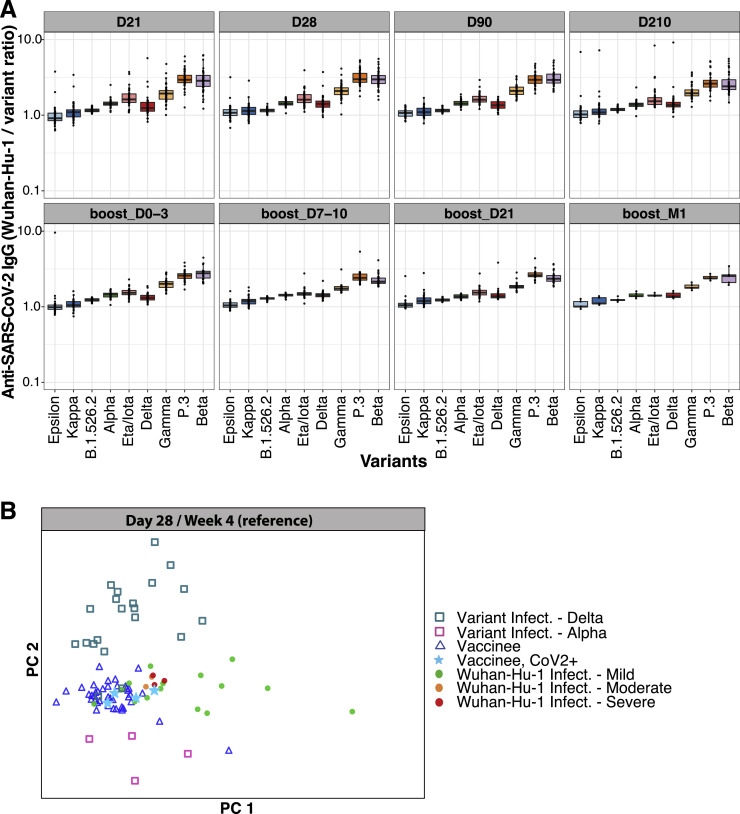
Figure S5.
Anti-SARS-CoV-2 RBD IgG signatures following BNT162b2 vaccination and SARS-CoV-2 infection, related to Figure 5
(A) Ratios of anti-Wuhan-Hu-1 to variant RBD IgG concentration are shown for Stanford individuals who received BNT162b2 vaccination at different time points after the second dose (D21, n = 58 individuals) and third dose (around month 9, n = 36 individuals) vaccination. Box-whisker plots show the interquartile range as the box and the whisker ends as the most extreme values within 1.5 times the interquartile range below the 25% quantile and above the 75% quantile.
(B) Principal component analysis (PCA) of anti-SARS-CoV-2 Wuhan-Hu-1 and viral variant RBD IgG concentrations across Stanford BNT162b2 vaccinees, Stanford COVID-19 patient cohort 2, and SARS-CoV-2-variant-infected patients.

