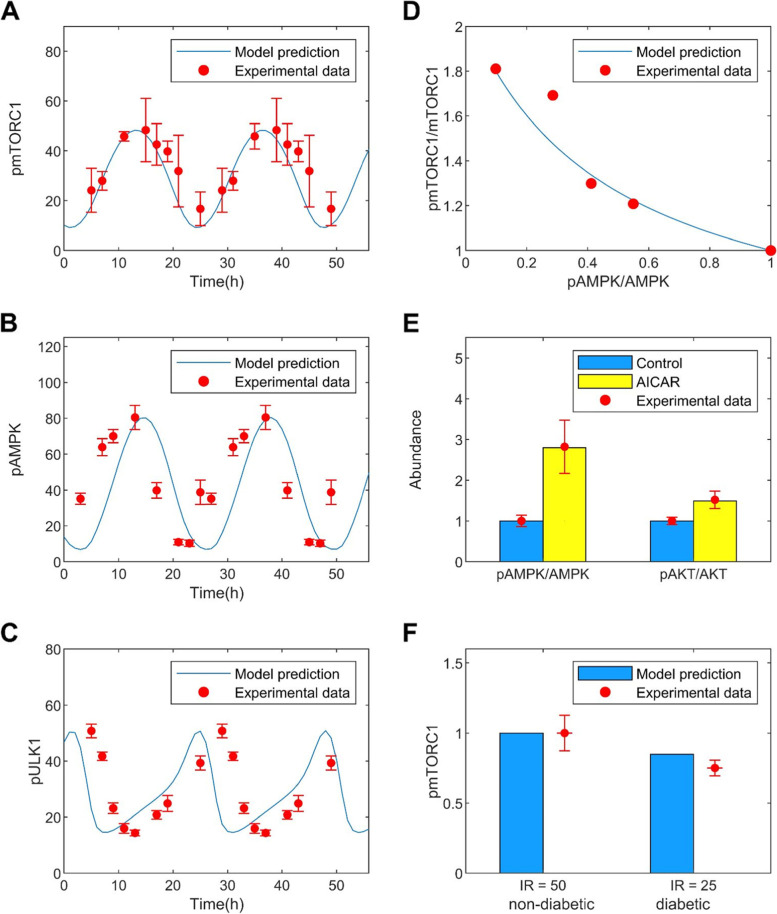
Fig. 2.
Model parameters are fitted against experimental data. A-C, oscillatory model solution under energetic stress. Predicted time profiles are shown for pmTORC1, pAMPK, and pULK1, together with the corresponding experimental data points [38]. D, predicted phosphorylated-to-unphosphorylated mTORC1 ratio as a function of AMPK activation, compared with data from [39]. E, predicted activation of AMPK and AKT following AICAR administration, compared with data from [29, 40]. F, predicted abundance of phosphorylated mTORC1 at different insulin receptor levels, corresponding to healthy and diabetic conditions. Diabetes values are normalized by the respective non-diabetes values. Experimental data [44] are shown in red dots with error bars

