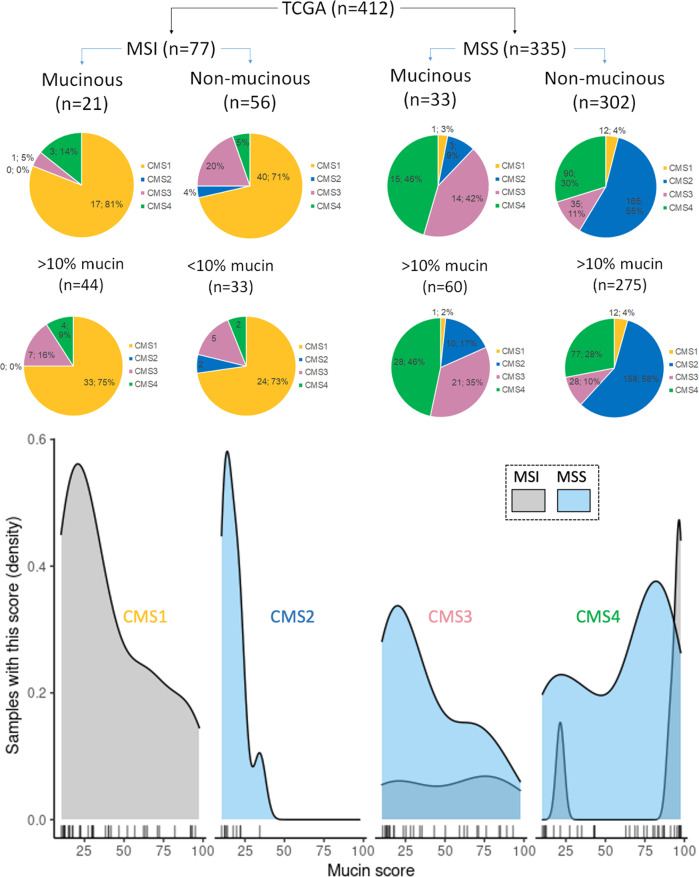
Fig. 2. Subgroup analysis of MSI/MSS tumors by mucinous histology and CMS groups.
(Pie-Chart) Distribution of CMS classifications by MSI status in (first row) mucinous and non-mucinous (adenocarcinoma) colorectal cancers and (second row) high or low mucin content based on 10% threshold from the TCGA database. (Line-Chart) Plot of the density of each mucin score by MSI status across each CMS group in mucinous samples (mucin score >10%). The x-axis shows the %-mucin detected by the AI algorithm with each line representing a sample with that value. In CMS1 and CMS3, mucin values are distributed throughout the range of possible values from 0–100%, while no case in CMS2 reaches the threshold of 50% to be declared as “mucinous”. CMS4 points towards a bimodal distribution of mucin scores.

