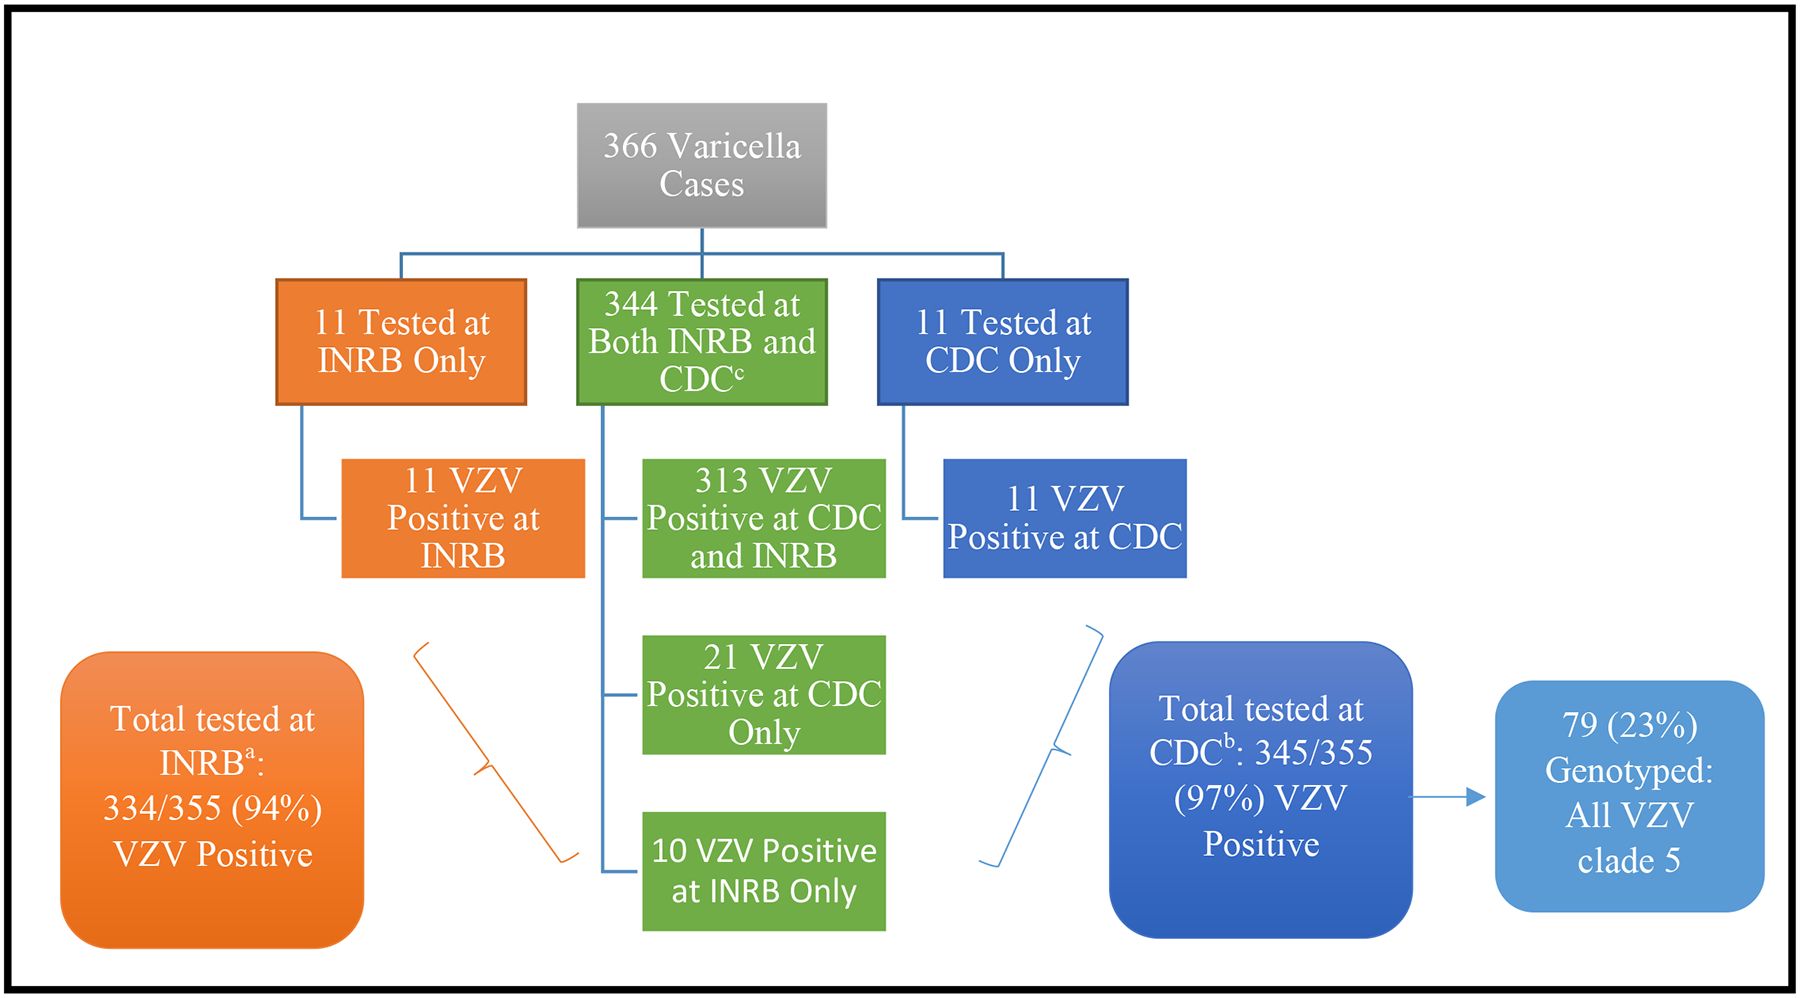
Figure 4. Flow diagram of varicella-zoster virus (VZV) laboratory results from specimens tested at Institut National de Recherche Biomedicale (INRB) and the Centers for Disease Control and Prevention (CDC).

aA total of 476 specimens from 355 varicella patients were submitted to INRB for testing; 263 specimens (55%) were vesicular fluid, 192 (40%) were crusts, and 21 (4%) were blood specimens. Of these 355 patients, 237 (67%) had 1 specimen tested for VZV and 118 (33%) had ≥3 specimens tested. After testing at INRB, 334 (94%) of the 355 case-patients had ≥1 VZV positive specimen by PCR.
bThere were 294 DNA specimens extracted at INRB. An additional 412 skin lesion specimens (59% from vesicles) from 355 patients were sent to the CDC National VZV Laboratory. Among these 355 patients, 106 (30%) had 1 specimen tested and 249 (70%) had ≥3 specimens tested. After testing at CDC, 345 (97%) of the 355 patients with specimens sent to CDC had ≥1 VZV positive specimen by PCR.
cAmong the 344 specimens tested at both INRB and CDC, there were 91% (313) with concordant results, and 9% (31) with discordant results. Reasons for the discordant results could be due to differences in assay sensitivity, different specimens tested from the same patient, or potential false positive results if a high number of PCR cycles for amplification were used.
