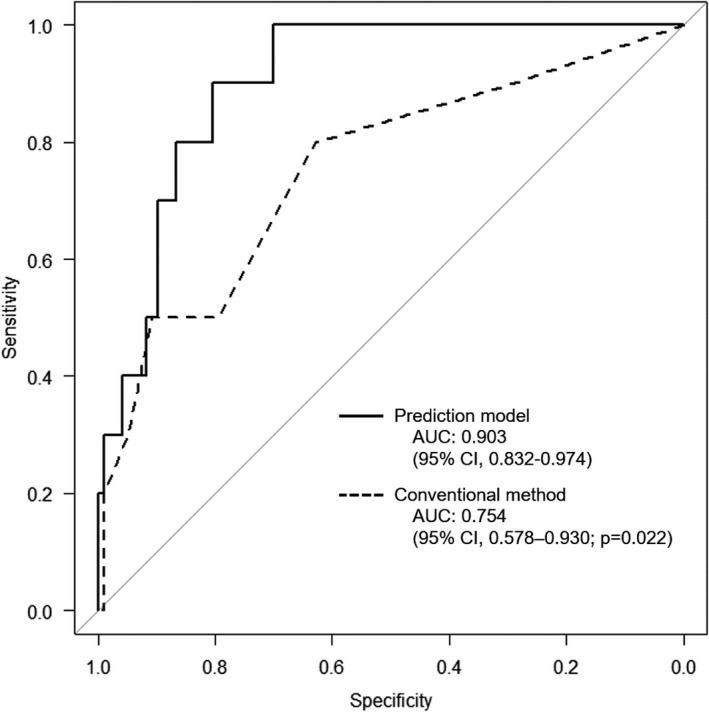
FIGURE 4.

ROC curves of the prediction model and the conventional diagnosis method in the validation cohort. The predictive power of the prediction model was compared to that of the conventional method using the short‐axis diameter of the largest LLN, as detected on MRI in the validation cohort. AUC, area under ROC curves; CI, confidence interval; LLN, lateral lymph node; MRI, magnetic resonance imaging; ROC curves, receiver operating characteristic curves
