FIGURE 1.

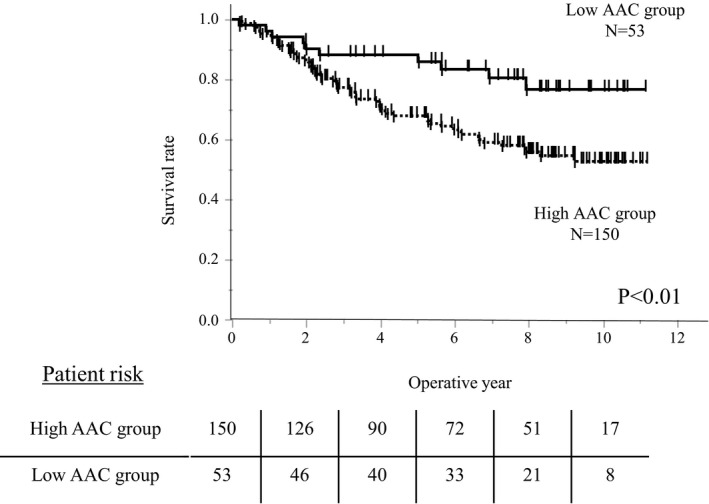
Kaplan–Meier survival curve according to the abdominal aortic calcification (AAC) levels. Kaplan–Meier survival curve analysis showed significantly worse overall survival in the high AAC group than in the low AAC group

Kaplan–Meier survival curve according to the abdominal aortic calcification (AAC) levels. Kaplan–Meier survival curve analysis showed significantly worse overall survival in the high AAC group than in the low AAC group