
FIGURE 1.
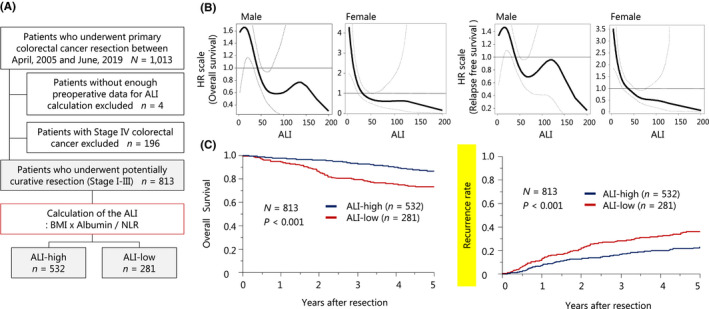
The preoperative ALI and long‐term patient outcome. (A) Flow chart for this study (inclusion/exclusion criteria). (B) Spline plots showing the HR for the overall survival and RFS using the preoperative ALI. (C) The probabilities (Kaplan–Meier plots) for the overall survival and recurrence rate. ALI, advanced lung cancer inflammation index; BMI, body mass index; HR, hazard ratio; NLR, neutrophil‐to‐lymphocyte ratio