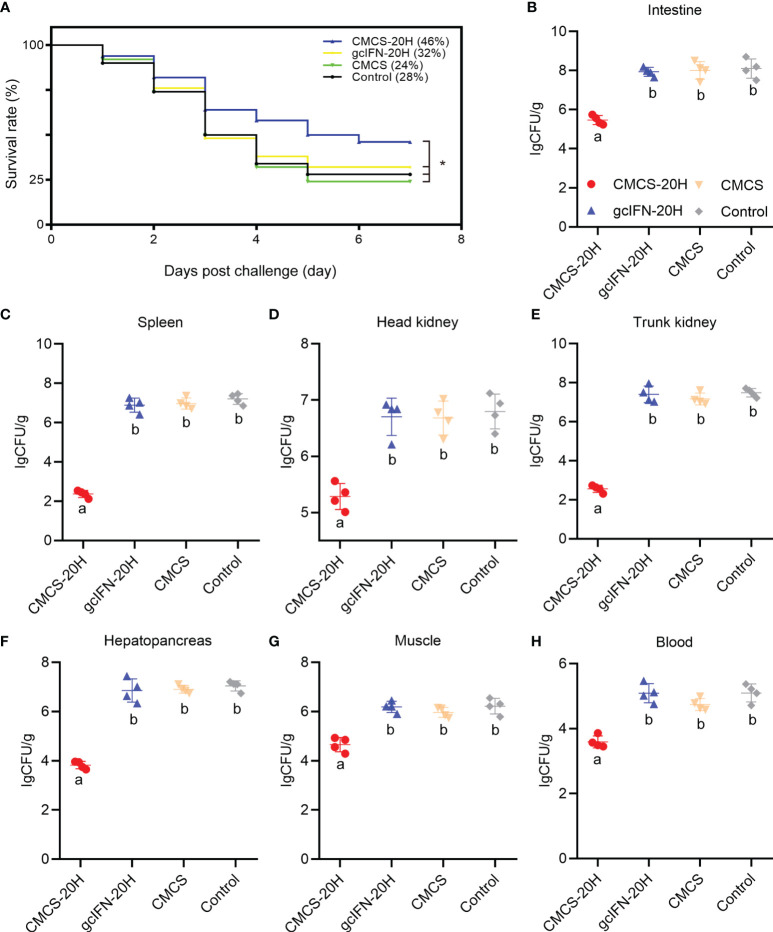
Figure 4.
The survival rate and tissue bacterial load in grass carp post-A. hydrophila infection. (A) Survival rate was monitored and calculated for 7 days. (B–H) The content of A. hydrophila in each tissue (intestine, spleen, head kidney, trunk kidney, hepatopancreas, muscle, blood) in infected grass carp in each treatment group (n = 50). Samples were taken at 72 h postchallenge. Data are presented as means ± SD (n = 4). Different lowercase letters in each group (a and b) denote significant variations suggested by the Kruskal-Wallis statistics followed by the Dunn’s multiple comparison (p < 0.05). p values were calculated by Log-rank (Mantel-Cox) Test. * denotes significant variation (p < 0.05).

