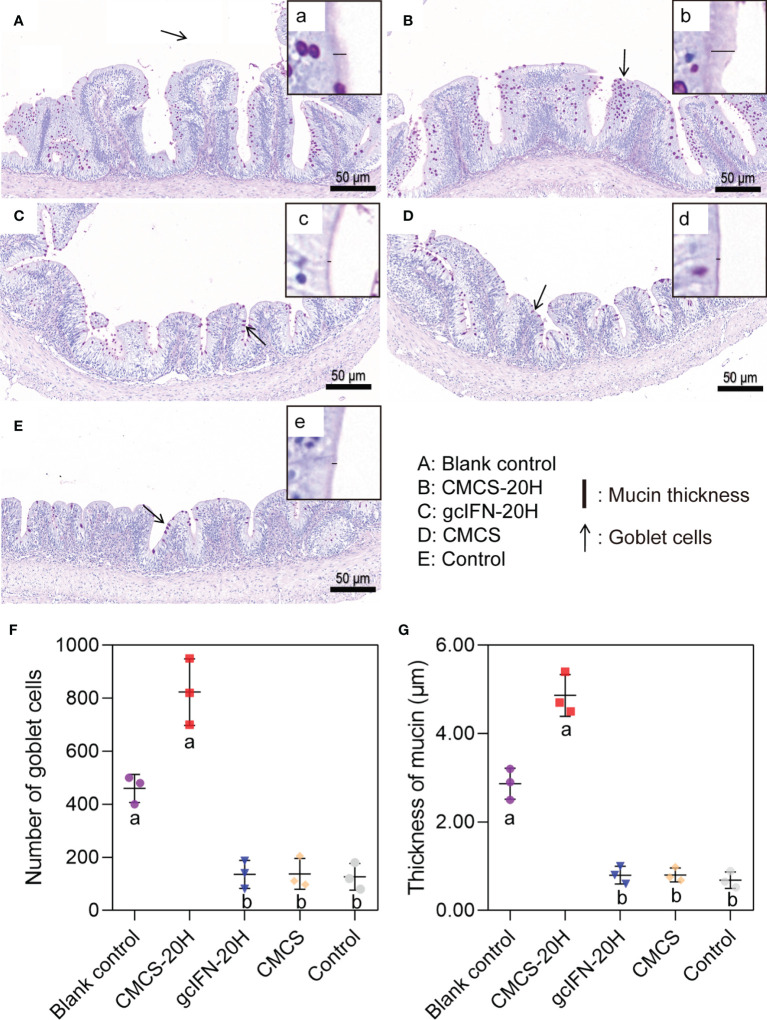
Figure 5.
Mucus barrier investigations in grass carp intestine. (A–E) PAS staining of intestine section. The goblet cells are marked with black arrows. (a–e) Magnification of black box region to show the mucin thickness. The thickness of mucin was measured with a black line segment. (F) The number of goblet cells. Three fields (×20) were selected for goblet cell count. (G) The thickness measurement of mucin. Three fields (×70) were selected for goblet cell count. Samples were taken on D46. Different lowercase letters in each group (a and b) denote significant variations suggested by the Kruskal-Wallis statistics followed by the Dunn’s multiple comparison (p < 0.05).

