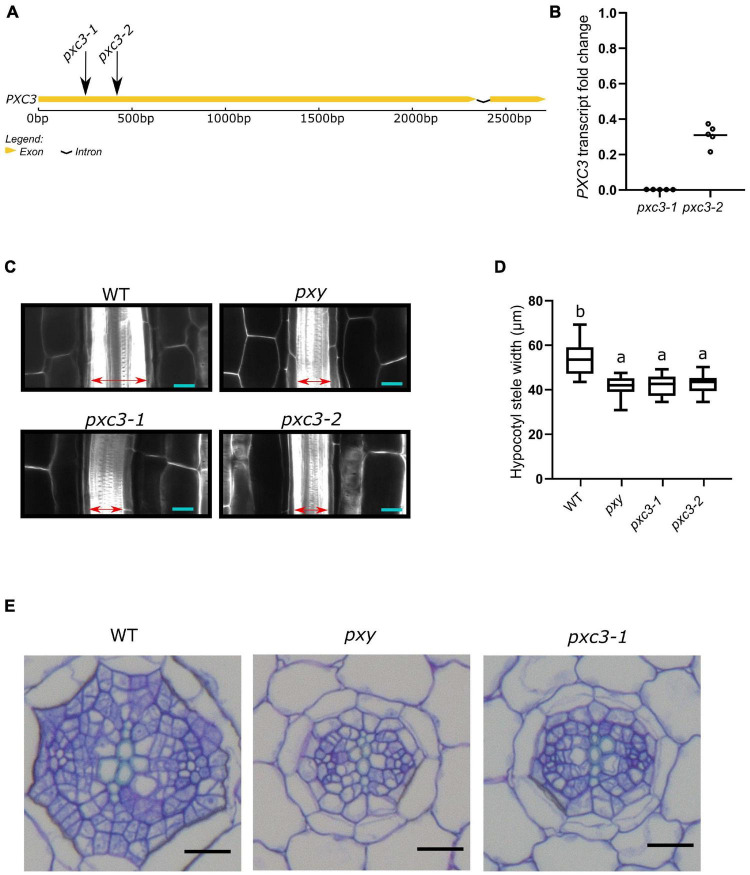
FIGURE 2.
pxc3 mutants have reduced stele in the hypocotyl of Arabidopsis seedlings. (A) Structure of PXC3 gene. The arrows indicated the approximate position of the T-DNA insertion in pxc3 mutants. (B) PXC3 expression levels in pxc3-1 and pxc3-2 mutants compared to wild type determined by qPCR in 5 independent biological replicates (individual data points). Transcript fold change relative to wild type is shown. (C) Longitudinal confocal sections of wild type and mutant hypocotyls (7 DAG seedlings). The double-sided arrow indicates the stele width. Scale bars represent 20 μm. This experiment was done three times with similar results. (D) Quantification of the stele width in wild type and mutant hypocotyls (n ≥ 15). One-way ANOVA followed by Tukey’s test was performed, and the lowercase letters indicate statistical differences (P < 0.05). (E) Cross-section of wild type and mutant hypocotyls (7 DAG seedlings). Scale bars represent 20 μm.

