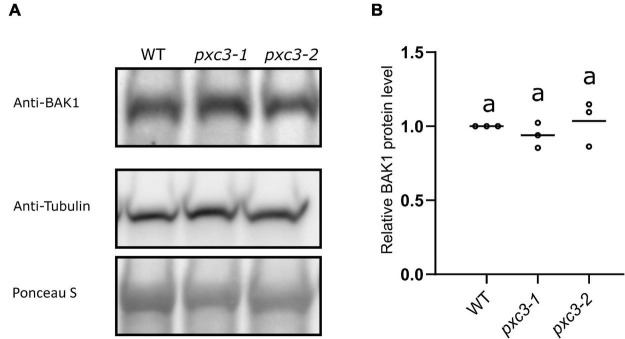
FIGURE 4.
BAK1 protein levels in wild type and pxc3 mutants. (A) Western blot analysis of BAK1 protein levels as detected by anti-BAK1 antibodies in wild type and pxc3 mutant seedlings. Blots were reblotted with anti-tubulin in two out of three performed experiments, all showing similar results. (B) Quantification of BAK1 protein levels in wild type and pxc3 mutants. For each experiment, BAK1 signal in the mutants was normalized by that in wild type. Individual data points for each experiment are shown. One-way ANOVA analysis was performed followed by Tukey’s test, and the lowercase letters indicate statistical differences (P < 0.05).

