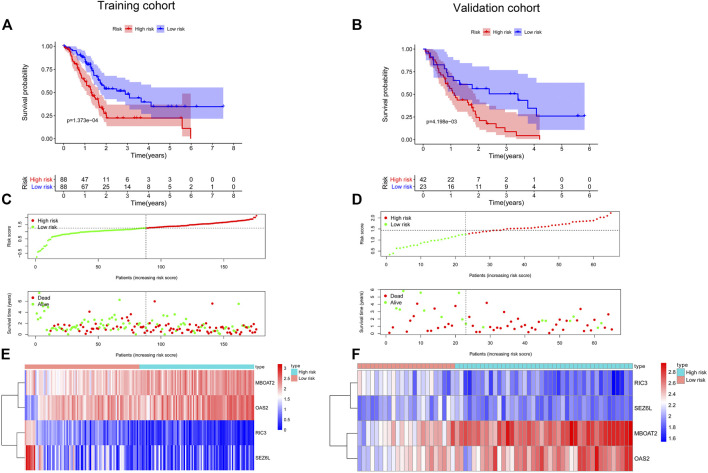
FIGURE 6.
Establishment and validation of a prognostic model for PC. Kaplan–Meier survival curves showed that the high-risk group had shorter OS than the low-risk group in the training cohort (A) and the validation cohort (B). The distribution of the survival status and time in different risk groups by the scatter plots in the training cohort (C) and the validation cohort (D). Heatmap of the four screened DNA methylation-driven gene expression in the high- and low-risk groups from the training cohort (E) and the validation cohort (F). PC, pancreatic cancer; OS, overall survival.

