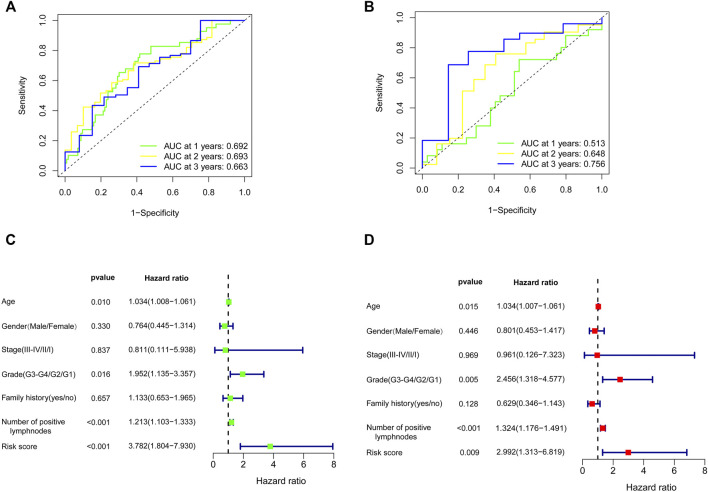
FIGURE 7.
Effects of the risk score model and clinical parameters on the prognosis of PC patients. The time-dependent ROC curve for predicting the 1-, 2-, and 3-year OS rates in TCGA training cohort (A) and GEO validation cohort (B). Identification of the parameters related to OS by univariate (C) and multivariate Cox analyses (D). PC, pancreatic cancer; ROC, receiver operating characteristic; OS, overall survival; TCGA, The Cancer Genome Atlas; GEO, Gene Expression Omnibus.

