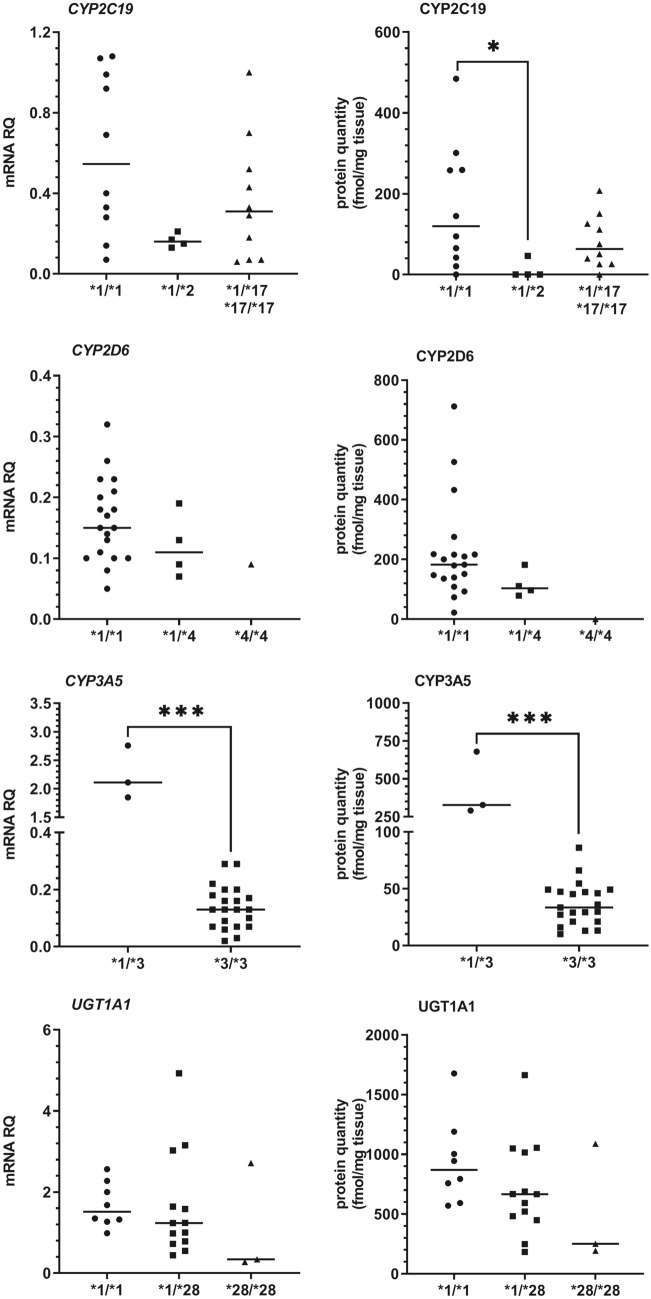
Fig. 4.
The impact of genotype on mRNA and protein abundance of drug-metabolizing enzymes (CYP2C19, CYP3A5, CYP2D6, and UGT1A1) in all study participants (n = 24). Horizontal bars represent median values for each group. Values for mRNA are shown as relative quantity in relation to mean expression of five housekeeping genes (GAPDH, PPIA, HMBS, RPLP0, and RPS9). Significant p values are marked with asterisks (*p < 0.05; ***p < 0.001)

