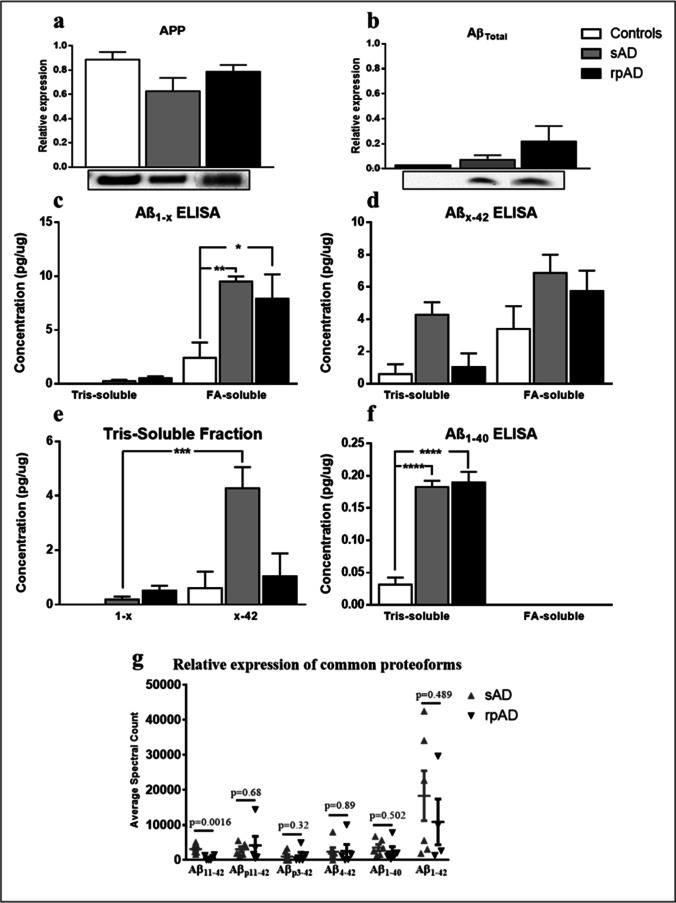
Fig. 3.
Relative expression of APP and various proteoforms of Aβ in brain samples. The expression of (a) APP, (b) AβTotal, (c) C-terminally truncated proteoforms, (d) N-terminally truncated proteoforms, and (f) Aβ40 in controls, sAD and rpAD cases quantified using IB and ELISA analysis (n = 4–6). (e) Comparison of various truncations within the tris-soluble fraction is also presented. (g) The average spectrum counts obtained for common proteoforms, other than Aβ11-42, by MALDI-MS also reflected results similar to ELISA analysis. All blots were subjected to total protein normalization and data from three independent experiments was used for densitometric analysis while the ELISA averages were obtained by analyzing all samples as duplicates. Error bars represent SEM. One-way ANOVA, followed by Tukey’s multiple comparisons test, was used for statistical analysis. (*p ≤ 0.05; **p ≤ 0.01; ***p ≤ 0.001)

