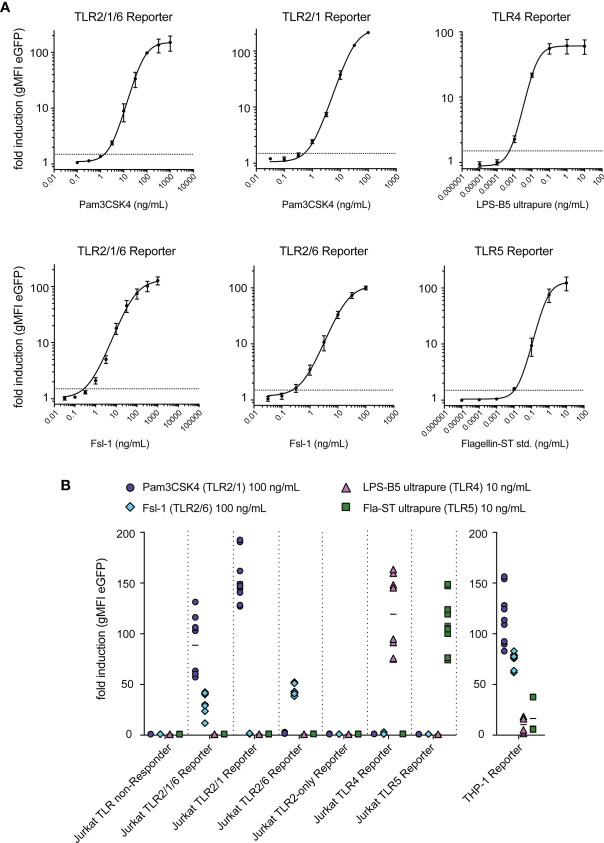
Figure 3.
Sensitivity and specificity of TLR reporter cells. (A) Titration curves for typical ligands of each TLR reporter cell, with a dashed line at fold induction of 1.5 representing the limit of detection; summary of representative experiments performed in duplicates (n = 2 for TLR2/1/6, TLR2/1, TLR2/6, TLR4 reporter, n = 3 for TLR5 reporter). (B) Reactivity of each reporter cell line to the typical ligands of TLR2/1 (Pam3CSK4, 100 ng/mL), TLR2/6 (Fsl-1, 100 ng/mL), TLR4 (LPS-B5 ultrapure, 10 ng/mL) and TLR5 (Fla-ST ultrapure, 10 ng/mL) (n = 6, each experiment was performed in duplicates).

