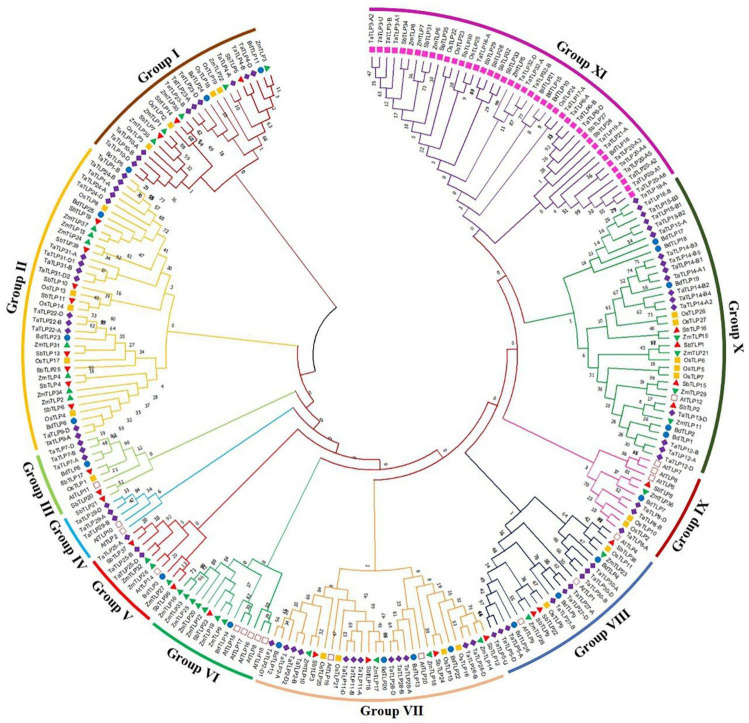
FIGURE 3.
Phylogenetic tree analysis of A. thaliana, B. distachyon, O. sativa. S, bicolor, T. aestivum, and Z. mays using full-length peptide of TLPs. The figure shows the phylogenetic tree of TLPs, built by the maximum likelihood approach with 1000 bootstrap values using MEGA X software. The phylogenetic tree displays the clustering of TLPs of six plant species in I-XI different groups, each group is colored differently. The TLPs from each plant are marked with a different color.

