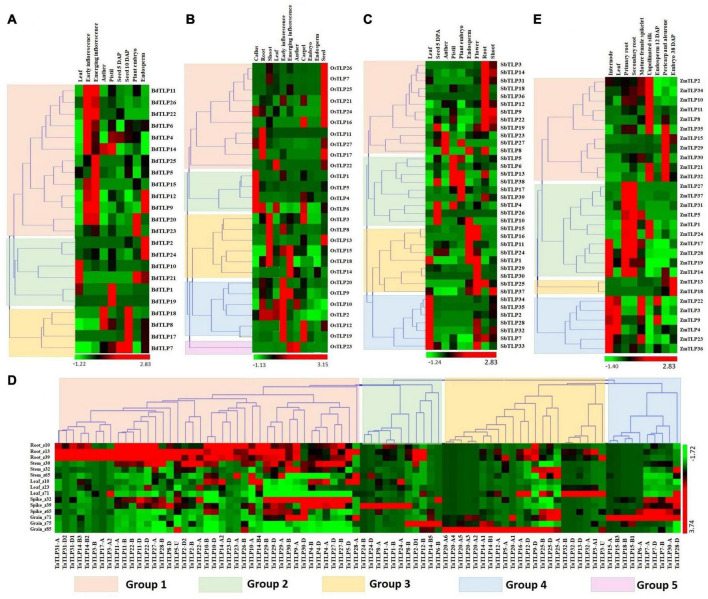
FIGURE 5.
Expression analysis of TLP genes of B. distachyon (BdTLP), O. sativa (OsTLP). S. bicolor (SbTLP), T. aestivum (TaTLP), and Z. mays (ZmTLP) under various tissue and developmental stages. Heat maps (A–E) show the clustering and expression profiling of TLP genes in (A) B. distachyon, (B) O. sativa, (C) S. bicolor, (D) T. aestivum, and (E) Z. mays. The different clusters are formed based on expression values of TLP genes in the respective crop, which are represented with different colors. The color bar depicts the upregulated and downregulated expression with red and green colors, respectively.

