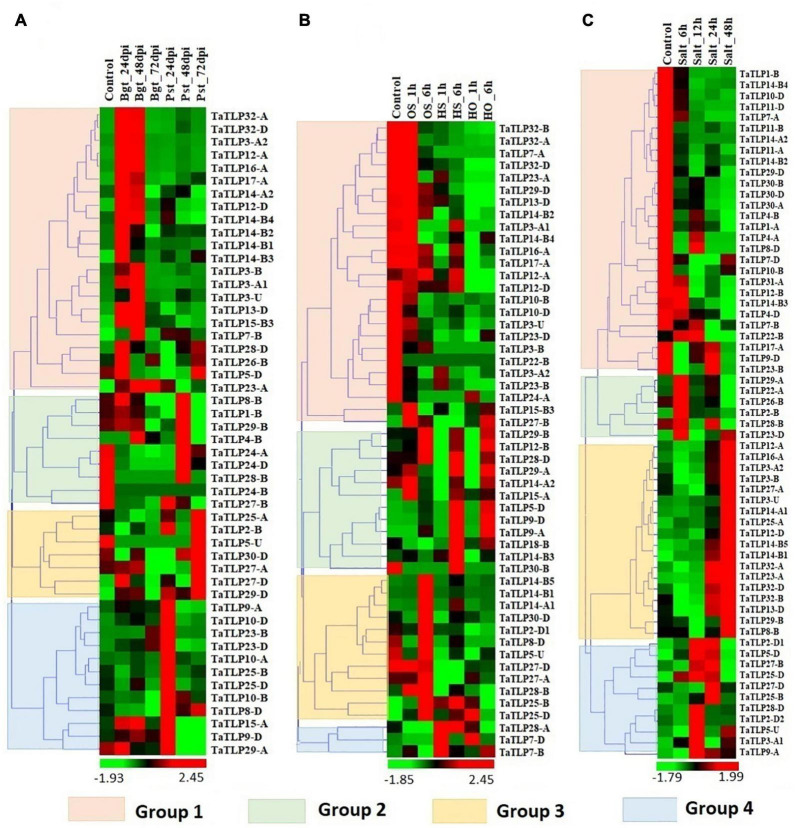
FIGURE 6.
Expression profiling of TLP genes of T. aestivum under biotic and abiotic stress conditions. Heat maps (A–C) show the clustering and expression profiling of TaTLP genes under (A) Blumeria graminis (Bgt) and Puccinia striiformis (Pst), (B) heat (HS), osmotic (OS), and combined heat and osmotic (HO), and (C) salt stress conditions. The clustering of TaTLP genes in each heat map is based on their expression pattern in respective stress conditions. The color bar shows high and low expressions with red and green colors, respectively.

