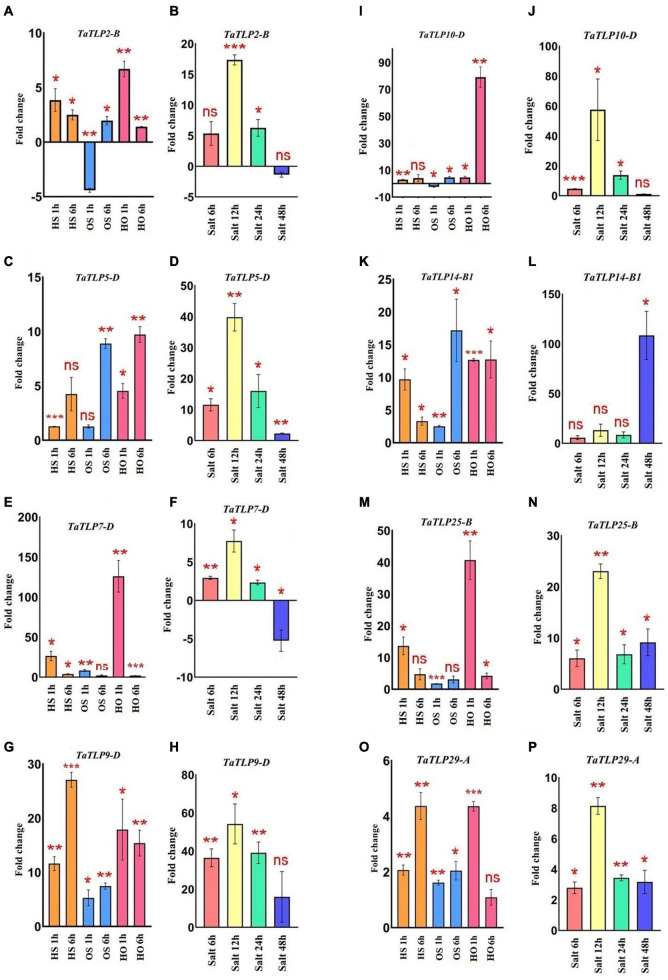
FIGURE 7.
qRT-PCR analysis of eight TaTLP genes. Expression patterns in the form of fold changes have been shown in the bar graphs. (A,C,E,G,I,K,M,O) Show expression of TaTLP2-B, TaTLP5-D, TaTLP7-D, TaTLP9-D, TaTLP10-D, TaTLP14-B1, TaTLP25-B, and TaTLP29-A genes, under HS, OS, and HO stress conditions, while (B,D,F,H,J,L,N,P) shows the expression pattern of these genes under salt stress, respectively. Significance between the control and treated conditions is carried using a two-tailed student’s t-test. The ns, *, **, and *** markings represent the significance at p-value > 0.05, ≤0.05, ≤0.01, ≤0.001, respectively.

