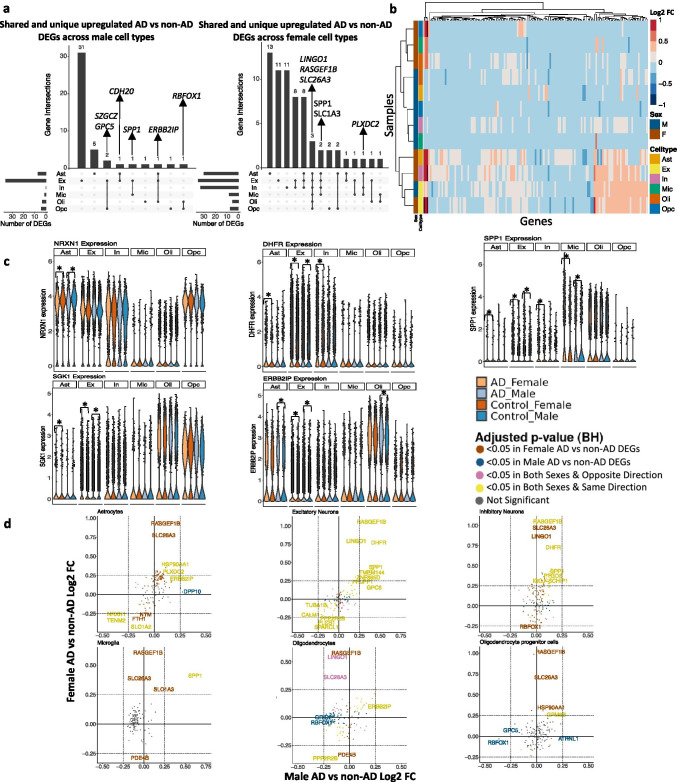
Fig. 2.
Sex-stratified cell type-specific differential gene expression signatures in the prefrontal cortex. a. Upset plots indicating intersections of AD versus non-AD DEGs (BH-adjusted p value < 0.05 and absolute LFC > 0.25) across cell types. Rows correspond to cell types. The bar chart shows the number of single and common sets of DEGs across cell types. Single filled dots represent a unique set of DEGs for the corresponding cell type. Multiple filled black dots connected by vertical lines represent common sets of DEGs across cell types. b. LFC scores of all genes in the DE analysis clustered by cell type and sex. c. LINGO1, PLXDC2, SPP1, RBFOX1, and ERBB21P expressions. Asterisks represent meeting both significance and absolute LFC thresholds. Colors correspond to sex and AD status. d. Pairwise DEG plots of DEGs in male and female samples using LFC scores. Genes shown are significant and have a LFC > 0.25 in at least one sex. Colors indicate significance level of DEGs and whether DEGs are unique or shared by both sexes

