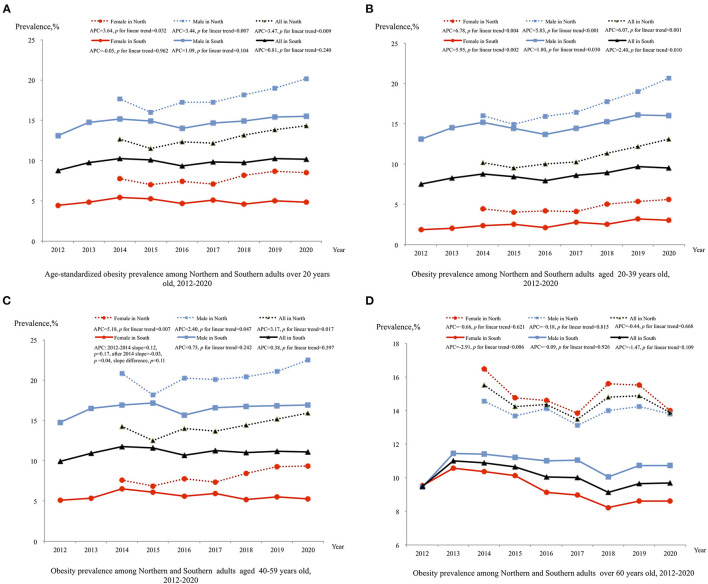
Figure 3.
Trend in prevalence of obesity adults in northern and southern China, 2012–2020. Estimates by different sex are age-standardized to the 2010 Chinese Census population using age groups 20–39, 40–59, and 60 or older and estimates for overall population are additional adjusted by sex; Significant linear trends (P < 0.05) for the following groups:(1) increased age-standardized obesity among all sex groups from northern China; (2) increased obesity among all 20–39 aged groups from northern and southern China; (3) increased obesity among all 40–59 aged groups from northern (P < 0.05); (4) among 40–59 aged female from southern China, obesity during 2012–2014 showed increased level [slope = 0.12 (95% CI: −0.07,0.30), P = 0.17], and level decreased after 2014 [slope = −0.03 (95% CI: −0.06, 0.00, P = 0.04], slope difference, P = 0.11; (5) decreased obesity among 60 and over aged female from southern. BMI, body mass index; APC, annual percentage change.

